Apache Kafka®️ 비용 절감 방법 및 최적의 비용 설계 안내 웨비나 | 자세히 알아보려면 지금 등록하세요
KSQL in Action: Real-Time Streaming ETL from Oracle Transactional Data
In this post I’m going to show what streaming ETL looks like in practice. We’re replacing batch extracts with event streams, and batch transformation with in-flight transformation. But first, a trip back through time…
My first job from university was building a data warehouse for a retailer in the UK. Back then, it was writing COBOL jobs to load tables in DB2. We waited for all the shops to close and do their end of day system processing, and send their data back to the central mainframe. From there it was checked and loaded, and then reports generated on it. This was nearly twenty years ago as my greying beard will attest—and not a lot has changed in the large majority of reporting and analytics systems since then. COBOL is maybe less common, but what has remained constant is the batch-driven nature of processing. Sometimes batches are run more frequently, and get given fancy names like intra-day ETL or even micro-batching. But batch processing it is, and as such latency is built into our reporting by design. When we opt for batch processing we voluntarily inject delays into the availability of data to our end users, and to applications in our business that could be driven by this data in real time.
Back in 2016 Neha Narkhede wrote that ETL Is Dead, Long Live Streams, and since then we’ve seen more and more companies moving to adopt Apache Kafka as the backbone of their architectures. With Kafka’s Connect and Streams APIs, as well as KSQL, we have the tools available to make Streaming ETL a reality.
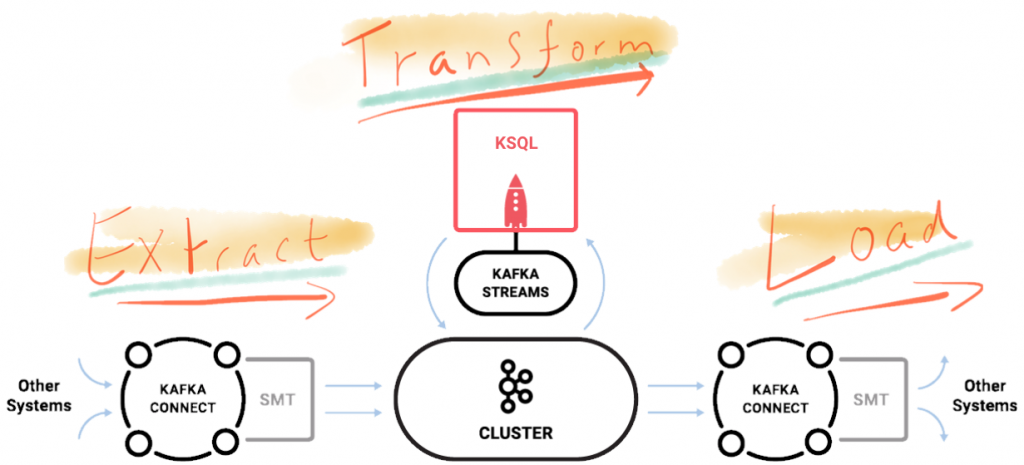

By streaming events from the source system as they are created, using Kafka’s Connect API, data is available for driving applications throughout the business in real time. Independently and in parallel, that same data can be transformed and processed and be made available to end users as soon as they want it. The key is that we are no longer batch-driven; we are event-driven.
Data enriched through the transform process is streamed back into Kafka. From here it can also be used by other applications. So we can refine raw inbound data, and use the resulting enriched and cleansed data for multiple purposes. Think of all the data cleansing and business logic that gets done as part of ETL…isn’t the resulting data useful in more places than just a static data store?
As a data engineer for an online store, you’re tasked with providing a real-time view for your sales operations team on current website activity. Which important customers are using the site? What’s the rolling value of orders being placed? But as well as an analytical ‘cockpit’ view, we can use the same enriched data to feed an event-driven microservice responsible for notifying the inside sales team when particularly important customers log on to the site. We can utilize the same logic and definitions once, for driving both the analytics and the microservice.
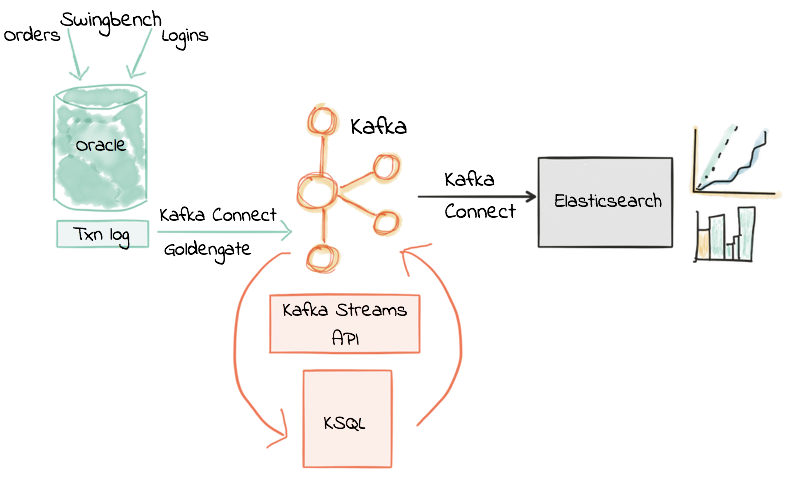
So in this post I’m going to show an example of what streaming ETL looks like in practice. I’m replacing batch extracts with event streams, and batch transformation with in-flight transformation of these event streams. We’ll take a stream of data from a transactional system built on Oracle, transform it, and stream it into Elasticsearch to land the results to, but your choice of datastore is up to you—with Kafka’s Connect API you can stream the data to almost anywhere! Using KSQL we’ll see how to filter streams of events in real-time from a database, how to join between events from two database tables, and how to create rolling aggregates on this data.

Let’s Get Started!
My source system is Oracle 12c, with the Order Entry schema and a transactional workload driven by a tool called Swingbench. I’m not using Swingbench here in its common capacity of load/stress-testing, but instead simply to generate a stream of transactions without needing to have access to a real data feed. To stream the data from Oracle, I’m using Oracle GoldenGate for Big Data. This is one of several Change-Data-Capture (CDC) tools available (others include DBVisit’s Replicate) which all work on the principal of taking the transaction log and streaming events from it to Kafka. There are plenty of other CDC tools around for other databases, including the popular Debezium project which is open-source and currently supports both MySQL and Postgres.
You can see details on the components I’ve used, and how to exactly reproduce them for your own experiments here.
The starting point for this is an inbound stream of events in Kafka from our source system (Oracle, via CDC). This is the “Extract” of our ETL, and is running in real time, event-by-event.
We’re going to apply some transformations to these events, and do so in real time—not batch! We’ll take a small set of the source tables containing:
- Orders
- Logon events
- Customer details
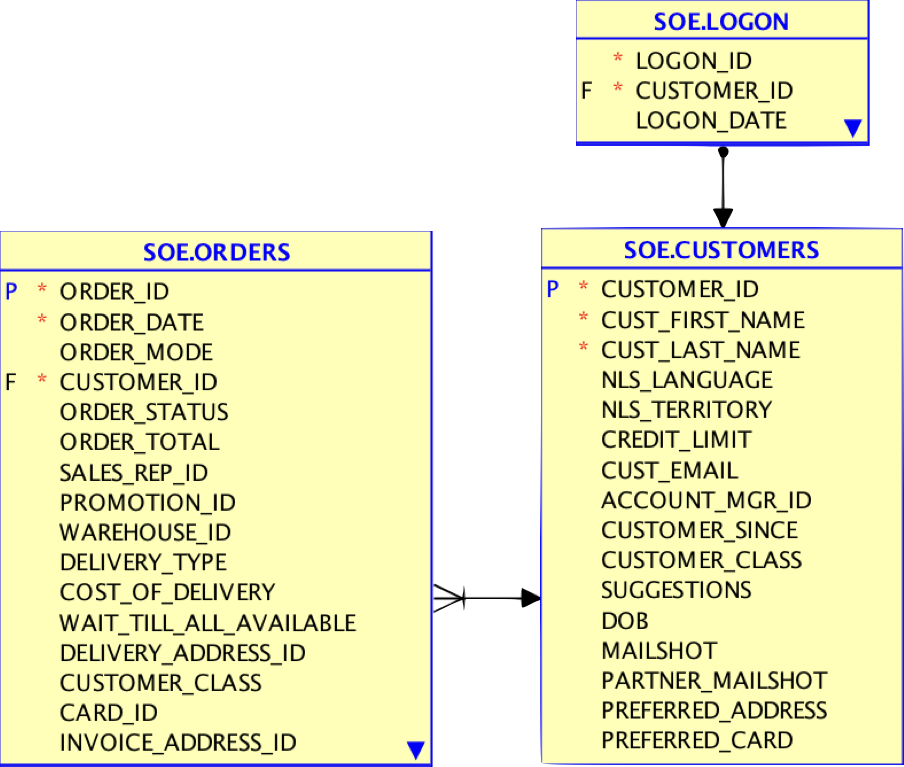
From these we will use KSQL to provide a real time stream of:
- Customers logging onto the application, with a second version of the stream filtered just to show customers of highest value who are logging in
- Aggregated order counts and values
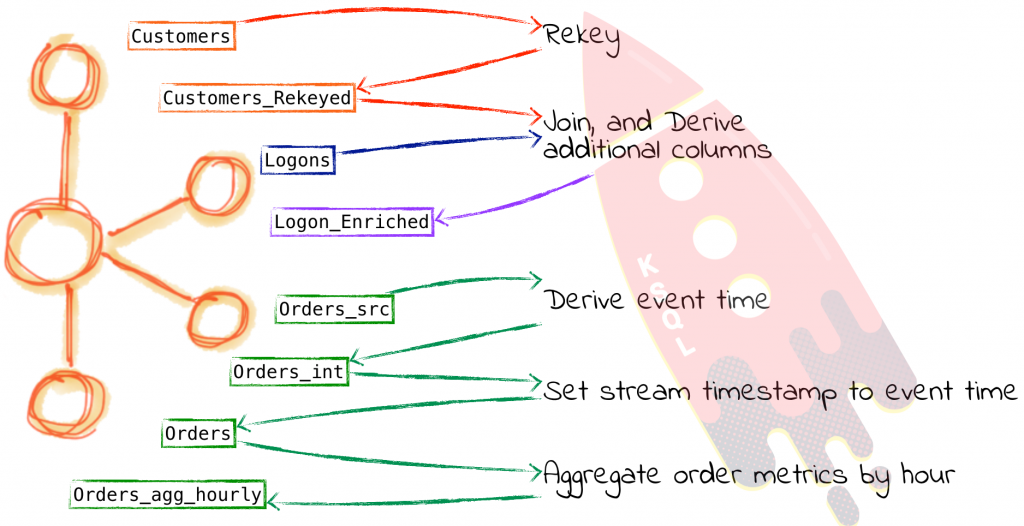
We’ll also see in a subsequent post how we’ll also use this enriched data that’s being written back to Kafka to drive a microservice. This microservice will send an alert to the inside sales team whenever a long-standing business customer logs on to the site.
Join and Filter Streams of Data from Oracle in KSQL
To join the customers to the logon event data, we will create a Table in KSQL on the Customers topic. We’re making a table because we only want to look at the current state of each customer; if we wanted to see a history of how a customer had changed over time, then we’d want a stream. The Logon data is a sequence of events, and so we just create a Stream on it. Having created both, we then join the two.
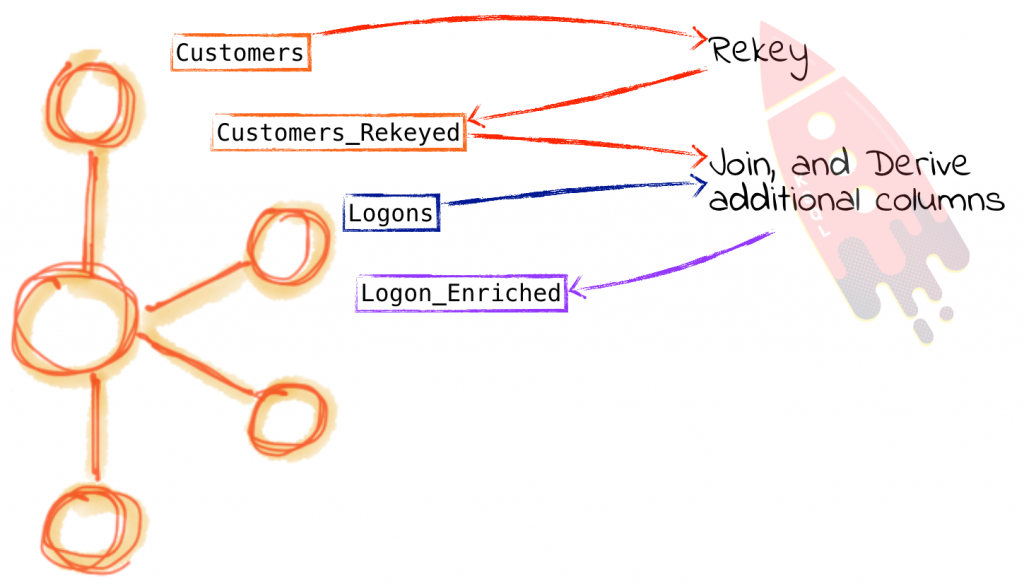
Firing up KSQL, first we define the customer table source topic:
ksql> CREATE STREAM CUST_SRC WITH (KAFKA_TOPIC='ora-ogg-SOE-CUSTOMERS-avro',
VALUE_FORMAT='AVRO');
Message
Stream created
Note that we’ve not had to specify the schema of the data, because it’s in Avro format and KSQL pulls the schema automagically from Confluent Schema Registry. To learn more about the schema registry and its importance in building applications see this great presentation from Gwen Shapira here. To specify the Schema Registry location you need to either pass --schema-registry-url to ksql-cli in local mode, or specify ksql.schema.registry.url in a properties file that you pass as an argument when starting up a standalone KSQL server.
ksql> DESCRIBE CUST_SRC;Field | Type
ROWTIME | BIGINT (system) ROWKEY | VARCHAR(STRING) (system) OP_TYPE | VARCHAR(STRING) OP_TS | VARCHAR(STRING) CURRENT_TS | VARCHAR(STRING) POS | VARCHAR(STRING) CUSTOMER_ID | BIGINT CUST_FIRST_NAME | VARCHAR(STRING) CUST_LAST_NAME | VARCHAR(STRING) NLS_LANGUAGE | VARCHAR(STRING) NLS_TERRITORY | VARCHAR(STRING) CREDIT_LIMIT | DOUBLE CUST_EMAIL | VARCHAR(STRING) ACCOUNT_MGR_ID | BIGINT CUSTOMER_SINCE | VARCHAR(STRING) CUSTOMER_CLASS | VARCHAR(STRING) SUGGESTIONS | VARCHAR(STRING) DOB | VARCHAR(STRING) MAILSHOT | VARCHAR(STRING) PARTNER_MAILSHOT | VARCHAR(STRING) PREFERRED_ADDRESS | BIGINT PREFERRED_CARD | BIGINT
We’ll set the topic offset to earliest so that any queries and derived streams that we create contain all of the data to date:
ksql> SET 'auto.offset.reset' = 'earliest';
Let’s have a quick peek at the data:
ksql> SELECT OP_TYPE,OP_TS,CUSTOMER_ID, CUST_FIRST_NAME, CUST_LAST_NAME FROM CUST_SRC LIMIT 1;
I | 2017-09-13 14:50:51.000000 | 74999 | lee | murray
LIMIT reached for the partition.
Query terminated
ksql>
Since we’re going to be joining on the customer ID, we need to rekey the table. KSQL’s DESCRIBE EXTENDED command can be used to inspect details about an object including key:
ksql> DESCRIBE EXTENDED CUST_SRC;Type : STREAM Key field : Timestamp field : Not set - using <ROWTIME> Key format : STRING Value format : AVRO [...]
We can use KSQL to easily rekey a topic, using the PARTITION BY clause:
ksql> CREATE STREAM CUST_REKEYED AS SELECT * FROM CUST_SRC PARTITION BY CUSTOMER_ID;
Check out the key for the new STREAM:
ksql> DESCRIBE EXTENDED CUST_REKEYED;Type : STREAM Key field : CUSTOMER_ID Timestamp field : Not set - using <ROWTIME> Key format : STRING Value format : AVRO Kafka output topic : CUST_REKEYED (partitions: 4, replication: 1) [...]
Two things of interest here – the key column is now CUSTOMER_ID, but we can also see that there is a Kafka output topic – CUST_REKEYED. Just for completeness, let’s check the key on the Kafka topics, using the awesome kafkacat:
Source topic:
Robin@asgard02 > kafkacat -C -c2 -K: -b localhost:9092 -o beginning -f 'Key:    %k\n' -t ora-ogg-SOE-CUSTOMERS-avro
Key:    74999_lee_murray_RC_New Mexico_6000.00_lee.murray@ntlworld.com_561_2009-06-05 00:00:00_Business_Electronics_1974-02-27 00:00:00_Y_N_49851_49851
Key:    75000_larry_perez_VX_Lithuania_6000.00_larry.perez@googlemail.com_514_2011-04-01 00:00:00_Occasional_Health_1960-11-30 00:00:00_Y_Y_114470_114470
Re-keyed topic
Robin@asgard02 > kafkacat -C -c2 -K: -b localhost:9092 -o beginning -f 'Key:    %k\n' -t CUST_REKEYED
Key:    75000
Key:    75004
So we’ve got our rekeyed topic. Now let’s build a table on top of it:
ksql> CREATE TABLE CUSTOMERS WITH (KAFKA_TOPIC='CUST_REKEYED', VALUE_FORMAT='AVRO', KEY='CUSTOMER_ID');Message
Table created
And finally, query the table that we’ve built:
ksql> SELECT ROWKEY, CUSTOMER_ID, CUST_FIRST_NAME, CUST_LAST_NAME, CUSTOMER_CLASS
FROM CUSTOMERS LIMIT 5;
75000 | 75000 | larry | perez | Occasional
74999 | 74999 | lee | murray | Business
75004 | 75004 | derrick | fernandez | Prime
75007 | 75007 | tony | simmons | Occasional
75014 | 75014 | roy | reed | Business
LIMIT reached for the partition.
Query terminated
ksql>
So – that’s our Customers reference table built and available for querying. Now to bring in the Logon events stream:
ksql> CREATE STREAM LOGON WITH (KAFKA_TOPIC='ora-ogg-SOE-LOGON-avro', VALUE_FORMAT='AVRO');Message
Stream created
That was easy! Let’s check we’re getting data from it:
ksql> SELECT LOGON_ID,CUSTOMER_ID,LOGON_DATE FROM LOGON LIMIT 5;
178724 | 31809 | 2000-11-08 23:08:51
178725 | 91808 | 2009-06-29 02:38:11
178726 | 78742 | 2007-11-06 15:29:38
178727 | 4565 | 2010-03-25 09:31:44
178728 | 20575 | 2000-05-31 00:22:00
LIMIT reached for the partition.
Query terminated
Now for the magic bit…joining the table and stream!
ksql> SELECT L.LOGON_ID, C.CUSTOMER_ID, C.CUST_FIRST_NAME, C.CUST_LAST_NAME,
C.CUSTOMER_SINCE, C.CUSTOMER_CLASS
FROM LOGON L LEFT OUTER JOIN CUSTOMERS C ON L.CUSTOMER_ID = C.CUSTOMER_ID;
You may see some nulls in the results, which is as a result of not all logon events having a corresponding customer entry. You can filter these out using:
ksql> SELECT L.LOGON_ID, C.CUSTOMER_ID, C.CUST_FIRST_NAME, C.CUST_LAST_NAME,
C.CUSTOMER_SINCE, C.CUSTOMER_CLASS
FROM LOGON L LEFT OUTER JOIN CUSTOMERS C ON L.CUSTOMER_ID = C.CUSTOMER_ID
WHERE C.CUSTOMER_ID IS NOT NULL LIMIT 5;
178771 | 75515 | earl | butler | 2002-07-19 00:00:00 | Occasional
178819 | 76851 | cesar | mckinney | 2000-10-07 00:00:00 | Regular
178832 | 77941 | randall | tucker | 2010-04-23 00:00:00 | Prime
178841 | 80769 | ramon | hart | 2011-01-24 00:00:00 | Occasional
178870 | 77064 | willard | curtis | 2009-05-26 00:00:00 | Occasional
LIMIT reached for the partition.
Query terminated
Watch out for this current issue if you’re joining on non-identical datatypes.
Having tested the simple join, we can start to build on it, adding in column concatenation (first + last name)
CONCAT(C.CUST_FIRST_NAME ,CONCAT(' ',C.CUST_LAST_NAME)) AS CUST_FULL_NAME
as well as calculations, here taking date on which the account was opened and using it to determine to the nearest year how long the person has been a customer. The functions used here are
- STRINGTOTIMESTAMP which converts the string timestamp into an epoch
- CAST(…AS DOUBLE) so that the BIGINT values can be accurately used in calculations
The completed statement, wrapped as a CREATE STREAM AS SELECT (CSAS) so that it can be used as the basis of subsequent queries, as well as instantiated as an underlying Kafka topic that can be used outside of KSQL, is as follows:
ksql> CREATE STREAM LOGON_ENRICHED AS
SELECT L.LOGON_ID, L.LOGON_DATE, C.CUSTOMER_ID,
CONCAT(C.CUST_FIRST_NAME ,CONCAT(' ',C.CUST_LAST_NAME)) AS CUST_FULL_NAME,
C.CUST_FIRST_NAME, C.CUST_LAST_NAME, C.CUSTOMER_SINCE,
C.CUSTOMER_CLASS, C.CUST_EMAIL,
(CAST(C.ROWTIME AS DOUBLE)-CAST(STRINGTOTIMESTAMP(CUSTOMER_SINCE,'yyyy-MM-dd HH:mm:ss')
AS DOUBLE))/ 60 / 60 / 24 / 1000/365 AS CUSTOMER_SINCE_YRS
FROM LOGON L
LEFT OUTER JOIN CUSTOMERS C
ON L.CUSTOMER_ID = C.CUSTOMER_ID ;
From the derived stream, we can then start querying both the original and derived columns, with a nice clear and understandable query:
ksql> SELECT LOGON_ID, LOGON_DATE, CUST_FULL_NAME, CUSTOMER_CLASS, CUSTOMER_SINCE_YRS FROM LOGON_ENRICHED;
178726 | 2007-11-06 15:29:38 | lloyd black | Occasional | 10.771086248255962
178732 | 2009-05-21 06:34:42 | donald hernandez | Occasional | 17.77108626258879
178742 | 2002-11-26 12:48:03 | kyle owens | Occasional | 15.776565717751144
178738 | 2004-09-27 05:36:23 | allen griffin | Business | 16.773825992548197
[...]
We can also start to apply filters to this, either ad-hoc:
ksql> SELECT LOGON_ID, LOGON_DATE, CUST_FULL_NAME, CUSTOMER_CLASS, CUSTOMER_SINCE_YRS
FROM LOGON_ENRICHED WHERE CUSTOMER_CLASS = 'Prime' LIMIT 5;
181362 | 2011-02-16 13:01:16 | isaac wong | Prime | 10.771086241850583
181551 | 2007-01-15 11:21:19 | ryan turner | Prime | 6.762867074898529
181576 | 2009-07-04 02:19:35 | peter campbell | Prime | 14.779305415810505
181597 | 2006-07-12 04:54:40 | andres fletcher | Prime | 13.782045160768645
181631 | 2002-09-08 03:06:16 | john johnson | Prime | 6.762867062690258
LIMIT reached for the partition.
Query terminated
or creating a further derived stream:
ksql> CREATE STREAM IMPORTANT_CUSTOMER_LOGONS AS SELECT LOGON_ID, LOGON_DATE, CUST_FULL_NAME, CUSTOMER_CLASS, CUSTOMER_SINCE_YRS FROM LOGON_ENRICHED WHERE CUSTOMER_CLASS = 'Business' AND CUSTOMER_SINCE_YRS > 10;Message
Stream created and running
ksql> SELECT * FROM IMPORTANT_CUSTOMER_LOGONS LIMIT 5;
1507286630384 | 83960 | 178738 | 2004-09-27 05:36:23 | allen griffin | Business | 16.773825992548197
1507286630386 | 92074 | 178773 | 2010-02-21 20:04:52 | gabriel garza | Business | 14.779305462899543
1507286630477 | 76111 | 181737 | 2007-05-17 23:59:36 | ray alvarez | Business | 12.765606788305432
1507286630401 | 87118 | 178936 | 2006-02-07 22:34:47 | kelly oliver | Business | 17.771086274733637
An important point here is that these derived streams are executing in real time, on events as they arrive, and populating Kafka topics with their results. So whilst the LOGON_ENRICHED stream might be for streaming into a general analytics platform, the IMPORTANT_CUSTOMER_LOGONS stream maybe directly drives a customer operations dashboard or application.
Building Streaming Aggregates in KSQL
As well as denormalizing data in order to make analysis easier by making relevant data available in one place, we can use KSQL to aggregate data. By aggregating inbound streams of events we can make available to other applications a real time stream of summary metrics about the events being processed. Aggregations are also a common pattern used in data warehousing to improve the performance of accessing data. Instead of storing data at its base granularity, it is “rolled up” to a higher grain at which it is commonly queried. For example, orders are placed as stream of events, but commonly a business operations analyst will want to know the value of orders placed per hour. Here’s a simple example of calculating just that.
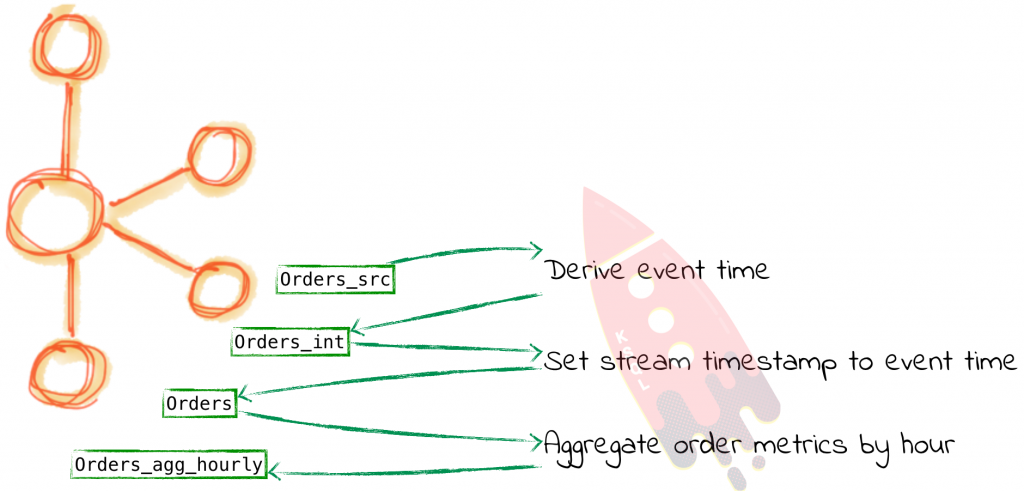
First we define our inbound event stream, which is coming from the ORDERS table on Oracle, streamed into the Kafka topic through the CDC process.
ksql> CREATE STREAM ORDERS_SRC WITH (KAFKA_TOPIC='ora-ogg-SOE-ORDERS-avro', VALUE_FORMAT='AVRO');
Since we’re going to be doing some time-based processing, we need to make sure that KSQL is using the appropriate timestamp value. By default it will use the timestamp of the Kafka message itself, which is the time at which the record was streamed into Kafka from the CDC source. You can see which column is being used with DESCRIBE EXTENDED:
ksql> DESCRIBE EXTENDED ORDERS_SRC;
Type : STREAM Key field : Timestamp field : Not set - using <ROWTIME> Key format : STRING Value format : AVRO [...]
You can see the actual timestamp too using the ROWTIME implicit column in any KSQL stream object:
ksql> SELECT TIMESTAMPTOSTRING(ROWTIME, 'yyyy-MM-dd HH:mm:ss') , ORDER_ID, ORDER_DATE
FROM ORDERS_SRC LIMIT 5;
2017-10-25 10:36:12 | 71490 | 2009-01-05 23:00:00.000000000
2017-10-25 10:36:12 | 71491 | 2011-07-26 01:00:00.000000000
2017-10-25 10:36:12 | 71492 | 2008-04-23 15:00:00.000000000
2017-10-25 10:36:12 | 71493 | 2009-04-03 09:00:00.000000000
2017-10-25 10:36:12 | 71494 | 2009-06-22 23:00:00.000000000
LIMIT reached for the partition.
Query terminated
ksql>
In the above output we can see that the ROWTIME (first column) is completely different from ORDER_DATE (third column). The former is the process time and the latter is the event time. For the purposes of our aggregations, since we are reporting on a business event (and not the physical processing detail) we want to make sure KSQL uses the event time (ORDER_DATE). Let’s first confirm what format the ORDER_DATE is in:
ksql> SELECT ORDER_DATE FROM ORDERS_SRC LIMIT 5;
2009-01-05 23:00:00.000000000
2011-07-26 01:00:00.000000000
2008-04-23 15:00:00.000000000
2009-04-03 09:00:00.000000000
2009-06-22 23:00:00.000000000
LIMIT reached for the partition.
Query terminated
With this knowledge, we can cast the string column to a timestamp, using STRINGTOTIMESTAMP and the Java time format:
ksql> SELECT ORDER_DATE, STRINGTOTIMESTAMP(ORDER_DATE,'yyyy-MM-dd HH:mm:ss.SSSSSSSSS')
FROM ORDERS_SRC LIMIT 5;
2009-01-05 23:00:00.000000000 | 1231196400000
2011-07-26 01:00:00.000000000 | 1311638400000
2008-04-23 15:00:00.000000000 | 1208959200000
2009-04-03 09:00:00.000000000 | 1238745600000
2009-06-22 23:00:00.000000000 | 1245708000000
LIMIT reached for the partition.
Query terminated
ksql>
From experience, I can suggest it’s always good to validate that you’ve got the date format strings correct, by checking the epoch value independently, using an online service or simple bash (removing the milliseconds first):
Robin@asgard02 > date -r 1231196400
Mon  5 Jan 2009 23:00:00 GMT
If the epoch doesn’t match the string input, check against the Java time format reference, and pay attention to the case particularly. DD means day of the year whilst dd is day of the month, and MM is the month of the year whilst mm is minutes of the hour. What could possibly go wrong…
Now we have the event time in epoch format, we can use this as the basis for defining an intemediary derived stream from this source one. We’re also going to capture the original ROWTIME since this is useful to know as well (what time the message hit Kafka from the CDC source):
ksql> CREATE STREAM ORDERS_INT_01 AS SELECT ROWTIME AS EXTRACT_TS, ORDER_DATE, STRINGTOTIMESTAMP(ORDER_DATE,'yyyy-MM-dd HH:mm:ss.SSSSSSSSS') AS ORDER_DATE_EPOCH, ORDER_ID, ORDER_STATUS, ORDER_TOTAL FROM ORDERS_SRC;Message
Stream created and running
ksql> SELECT ORDER_ID, ORDER_TOTAL, TIMESTAMPTOSTRING(EXTRACT_TS,'yyyy-MM-dd HH:mm:ss'), TIMESTAMPTOSTRING(ORDER_DATE_EPOCH, 'yyyy-MM-dd HH:mm:ss') FROM ORDERS_INT_01 LIMIT 5; 71491 | 5141.0 | 2017-10-25 10:36:12 | 2011-07-26 01:00:00 71494 | 3867.0 | 2017-10-25 10:36:12 | 2009-06-22 23:00:00 71498 | 5511.0 | 2017-10-25 10:36:12 | 2007-10-18 05:00:00 71501 | 4705.0 | 2017-10-25 10:36:12 | 2007-08-24 17:00:00 71504 | 6249.0 | 2017-10-25 10:36:12 | 2009-12-01 04:00:00 LIMIT reached for the partition. Query terminated
The final step is to use the new epoch column as the basis for our new Orders stream, in which we will use the TIMESTAMP property assignment to instruct KSQL to use the event time (ORDER_DATE_EPOCH) as the timestamp for the stream:
ksql> CREATE STREAM ORDERS WITH (TIMESTAMP ='ORDER_DATE_EPOCH') AS SELECT EXTRACT_TS, ORDER_DATE_EPOCH, ORDER_ID, ORDER_DATE, ORDER_STATUS, ORDER_TOTAL FROM ORDERS_INT_01;Message
Stream created and running
Inspecting DESCRIBE EXTENDED for the new stream shows that the Timestamp field is indeed being driven from the Order date (i.e. event time), and not the time at which the event hit our system:
ksql> DESCRIBE EXTENDED ORDERS;Type : STREAM Key field : Timestamp field : ORDER_DATE_EPOCH Key format : STRING Value format : AVRO Kafka output topic : ORDERS (partitions: 4, replication: 1) [...]
Now when we query this stream, and include ROWTIME (which is the actual time value KSQL will use for the aggregation) we can see that it matches what we had in the source ORDER_DATE column – the actual event time:
ksql> SELECT TIMESTAMPTOSTRING(ROWTIME, 'yyyy-MM-dd HH:mm:ss') , ORDER_DATE, ORDER_ID, ORDER_TOTAL
FROM ORDERS LIMIT 5;
2011-07-26 01:00:00 | 2011-07-26 01:00:00.000000000 | 71491 | 5141.0
2009-06-22 23:00:00 | 2009-06-22 23:00:00.000000000 | 71494 | 3867.0
2008-04-23 15:00:00 | 2008-04-23 15:00:00.000000000 | 71492 | 4735.0
2007-10-18 05:00:00 | 2007-10-18 05:00:00.000000000 | 71498 | 5511.0
2007-08-24 17:00:00 | 2007-08-24 17:00:00.000000000 | 71501 | 4705.0
LIMIT reached for the partition.
Query terminated
Phew! Now to actually build our aggregate:
ksql> CREATE TABLE ORDERS_AGG_HOURLY AS SELECT ORDER_STATUS, COUNT(*) AS ORDER_COUNT, MAX(ORDER_TOTAL) AS MAX_ORDER_TOTAL, MIN(ORDER_TOTAL) AS MIN_ORDER_TOTAL, SUM(ORDER_TOTAL) AS SUM_ORDER_TOTAL, SUM(ORDER_TOTAL)/COUNT(*) AS AVG_ORDER_TOTAL FROM ORDERS WINDOW TUMBLING (SIZE 1 HOUR) GROUP BY ORDER_STATUS;Message
Table created and running
This creates a table in KSQL, backed by a Kafka topic. At this point you have learned that the implicit column ROWTIME carries the information about event time. But now we are dealing with something new, which is the concept of windows. When a table is created and it is based on windows, you ought to use different constructions to refer to the start and end time of a given window. Starting from version 5.0, you now have the UDFs WindowStart() and WindowEnd() to refer to these values. You can learn more about these functions in the KSQL Syntax Reference for aggregates.
Using ROWTIME formatted in a human-readable format along with the WindowStart() function, we can inspect the aggregate:
ksql> SELECT TIMESTAMPTOSTRING(ROWTIME, 'yyyy-MM-dd HH:mm:ss'), ROWKEY, WindowStart(), ORDER_STATUS, MAX_ORDER_TOTAL, MIN_ORDER_TOTAL, SUM_ORDER_TOTAL, ORDER_COUNT, AVG_ORDER_TOTAL FROM ORDERS_AGG_HOURLY LIMIT 5;
2008-04-21 16:00:00 | 4 : Window{start=1208790000000} | 1545160440000 | 4 | 4067.0 | 4067.0 | 4067.0 | 1 | 4067.0
2007-11-20 21:00:00 | 4 : Window{start=1195592400000} | 1545160440000 | 4 | 3745.0 | 3745.0 | 3745.0 | 1 | 3745.0
2008-08-24 06:00:00 | 7 : Window{start=1219554000000} | 1545160440000 | 7 | 7354.0 | 7354.0 | 7354.0 | 1 | 7354.0
2008-03-25 05:00:00 | 3 : Window{start=1206421200000} | 1545160440000 | 3 | 2269.0 | 2269.0 | 2269.0 | 1 | 2269.0
2009-11-13 23:00:00 | 3 : Window{start=1258153200000} | 1545160440000 | 3 | 2865.0 | 2865.0 | 2865.0 | 1 | 2865.0
This implicit metadata can be exposed properly with a CTAS:
ksql> CREATE TABLE ORDERS_AGG_HOURLY_WITH_WINDOW AS
SELECT TIMESTAMPTOSTRING(WindowStart(), 'yyyy-MM-dd HH:mm:ss') AS WINDOW_START_TS, ROWKEY,
ORDER_STATUS, MAX_ORDER_TOTAL, MIN_ORDER_TOTAL, SUM_ORDER_TOTAL, ORDER_COUNT, AVG_ORDER_TOTAL
FROM ORDERS_AGG_HOURLY;
Checking out the raw Kafka messages shows that our aggregates are in place along with the window timestamp:
Robin@asgard02 > kafka-avro-console-consumer
                 --bootstrap-server localhost:9092
                 --property schema.registry.url=http://localhost:8081
                 --from-beginning
                 --topic ORDERS_AGG_HOURLY_WITH_WINDOW
                 --max-messages 1|jq '.'
{
  "WINDOW_START_TS": "2009-04-10 23:00:00",
  "ORDER_STATUS": 4,
  "MAX_ORDER_TOTAL": 3753,
  "MIN_ORDER_TOTAL": 3753,
  "SUM_ORDER_TOTAL": 33777,
  "ORDER_COUNT": 9,
  "AVG_ORDER_TOTAL": 3753
}
Processed a total of 1 messages
Note that as an aggregate is updated (either by data arriving within the current window, or late-arriving data) it is re-emitted, but with the same key (which includes the window) as before. This means that downstream we just need to take the key as the basis for storing the aggregate, and overwrite an existing keys with new values.
Streaming enriched data from Kafka into Elasticsearch
Let’s now take the data that originated in Oracle, streamed in through Kafka, enriched in KSQL, and land it to Elasticsearch. We can do this using Kafka Connect. We’re going to use a single connector to land the contents of both the enriched logons and the aggregated order metrics into Elasticsearch at once. You can load them individually too if you want.
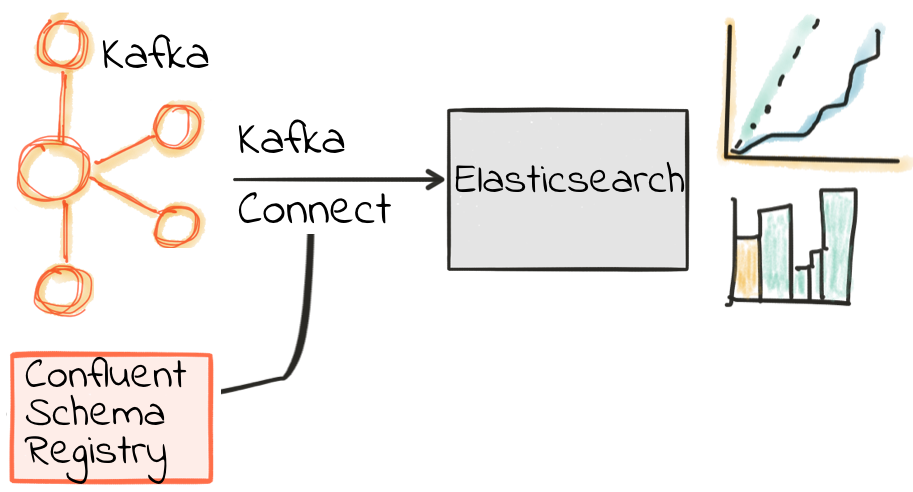

We’re going to use a Single Message Transform (SMT) to set the Timestamp datatype for LOGON_DATE string. This came from GoldenGate as a string, and in order for Elasticsearch to work seamlessly through Kibana we want the Kafka Connect sink to pass the datatype as a timestamp—which using the SMT will enable. The alternative is to use document templates in Elasticsearch to set the datatypes of certain columns, but SMT are neater in this case. We’ll use an SMT for the WINDOW_START_TS too, as this column we cast as a string for display purposes.
Here is the necessary Kafka Connect configuration to stream the Kafka data from two of the topics populated by KSQL into Elasticsearch:
cat > ~/es_sink.json&lt;&lt;EOF
{
"name": "es_sink",
"config": {
"connector.class": "io.confluent.connect.elasticsearch.ElasticsearchSinkConnector",
"value.converter": "io.confluent.connect.avro.AvroConverter",
"value.converter.schema.registry.url": "http://localhost:8081/",
"key.converter": "org.apache.kafka.connect.storage.StringConverter",
"key.converter.schemas.enable": false,
"type.name": "type.name=kafkaconnect",
"topics": "LOGON_ENRICHED,ORDERS_AGG_HOURLY_WITH_WINDOW",
"topic.index.map": "LOGON_ENRICHED:logon_enriched,ORDERS_AGG_HOURLY_WITH_WINDOW:orders_agg_hourly",
"connection.url": "http://localhost:9200",
"transforms": "convert_logon_date,convert_window_ts",
"transforms.convert_logon_date.type": "org.apache.kafka.connect.transforms.TimestampConverter$Value",
"transforms.convert_logon_date.target.type": "Timestamp",
"transforms.convert_logon_date.field": "LOGON_DATE",
"transforms.convert_logon_date.format": "yyyy-MM-dd HH:mm:ss",
"transforms.convert_window_ts.type": "org.apache.kafka.connect.transforms.TimestampConverter$Value",
"transforms.convert_window_ts.target.type": "Timestamp",
"transforms.convert_window_ts.field": "WINDOW_START_TS",
"transforms.convert_window_ts.format": "yyyy-MM-dd HH:mm:ss"
}
}
EOF
Load connector:
$ confluent load es_sink_logon_enriched -d ~/es_sink_logon_enriched.json
Confirm it’s running:
$ confluent status connectors|  jq '.[]'|  xargs -I{connector} confluent status {connector}|  jq -c -M '[.name,.connector.state,.tasks[].state]|join(":|:")'|  column -s : -t|  sed 's/\"//g'|  sort
es_sink_logon_enriched_01  |  RUNNING  |  RUNNING
If there’s an error then use confluent log connect to see details.
Verify that the SMT has done the trick for the date column, by inspecting the mapping defined for logons:
$ curl -s "http://localhost:9200/logon_enriched/_mappings"|jq '.logon_enriched.mappings."type.name=kafkaconnect".properties.LOGON_DATE.type'
"date"
and for the aggregated orders:
$ curl -s "http://localhost:9200/orders_agg_hourly/_mappings"|jq '."orders_agg_hourly".mappings."type.name=kafkaconnect".properties.WINDOW_START_TS.type'
"date"
Sample the data:
$ curl -s -Xget "http://localhost:9200/logon_enriched/_search?q=rick"|jq '.hits.hits[1]'
{
  "_index": "logon_enriched",
  "_type": "type.name=kafkaconnect",
  "_id": "83280",
  "_score": 7.5321684,
  "_source": {
    "CUST_LAST_NAME": "hansen",
    "CUSTOMER_SINCE_YRS": 11.806762565068492,
    "CUSTOMER_SINCE": "2006-12-16 00:00:00",
    "CUSTOMER_CLASS": "Occasional",
    "LOGON_DATE": "2003-07-03 05:53:03",
    "C_CUSTOMER_ID": 83280,
    "CUST_FULL_NAME": "rick hansen",
    "CUST_EMAIL": "rick.hansen@googlemail.com",
    "LOGON_ID": 65112,
    "CUST_FIRST_NAME": "rick"
  }
}
Add the index in Kibana and now we can monitor in real time what’s happening – using data from Oracle, streamed through Kafka, dynamically enriched and joined, and streamed into Elasticsearch.
Here’s a list of all logins, with the full details of the customer included:
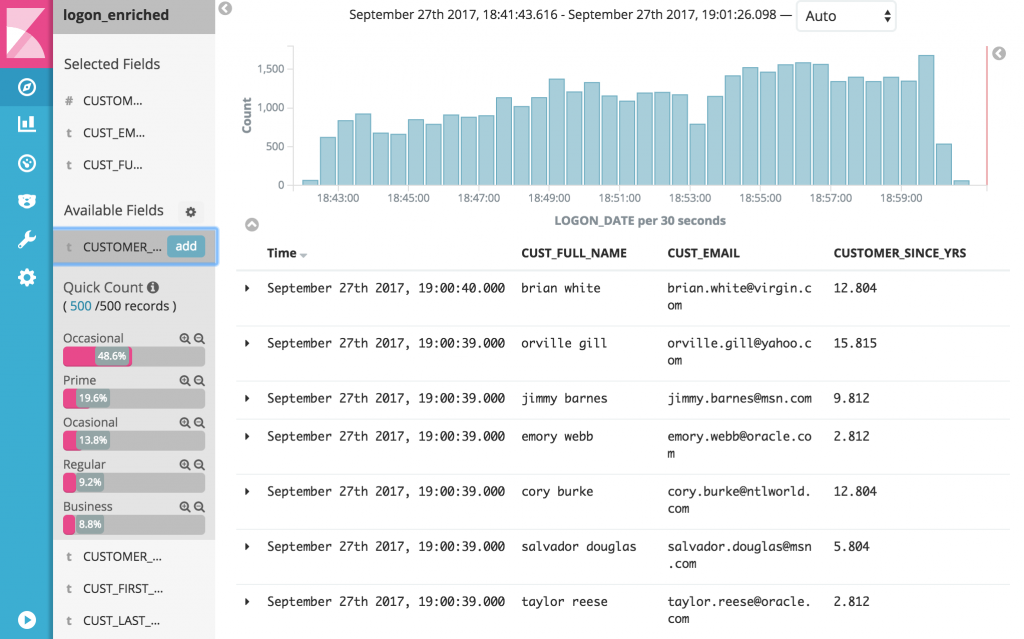
Now filtering all real time logins to show just those of “Business” type:
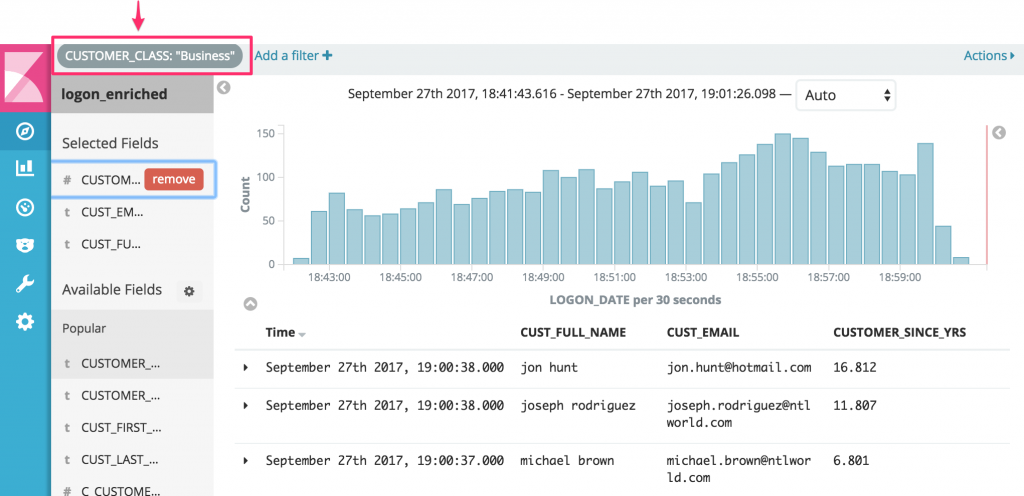
A useful point here is that whilst we can dynamically filter the data in the end-user tool, we could as easily generate a dedicated stream of justCUSTOMER_CLASS = 'Business' records using KSQL. It comes down to whether the data is to support exploratory/ad-hoc analytics, or to drive a business process that only needs data matching certain criteria.
With our data streaming from the transactional RDBMS system through Kafka and into a datastore such as Elasticsearch, it’s easy to build full dashboards too. These give a real time view over business events as they occur:
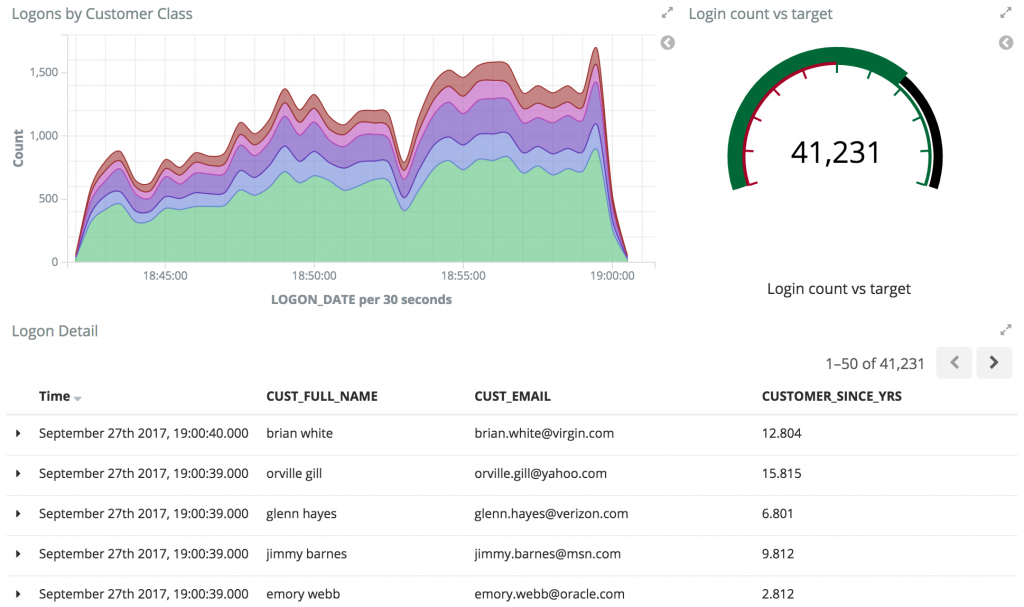
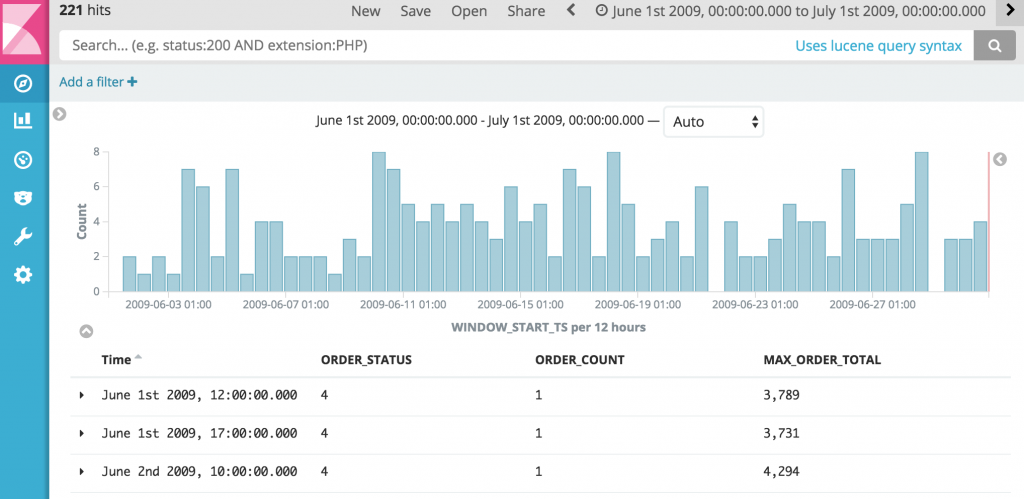
With the aggregate landed in our datastore, we can easily view the raw aggregate data in a table:
Building on the aggregates that we have created, we can add to the dashboard we created above, including information about the orders placed:
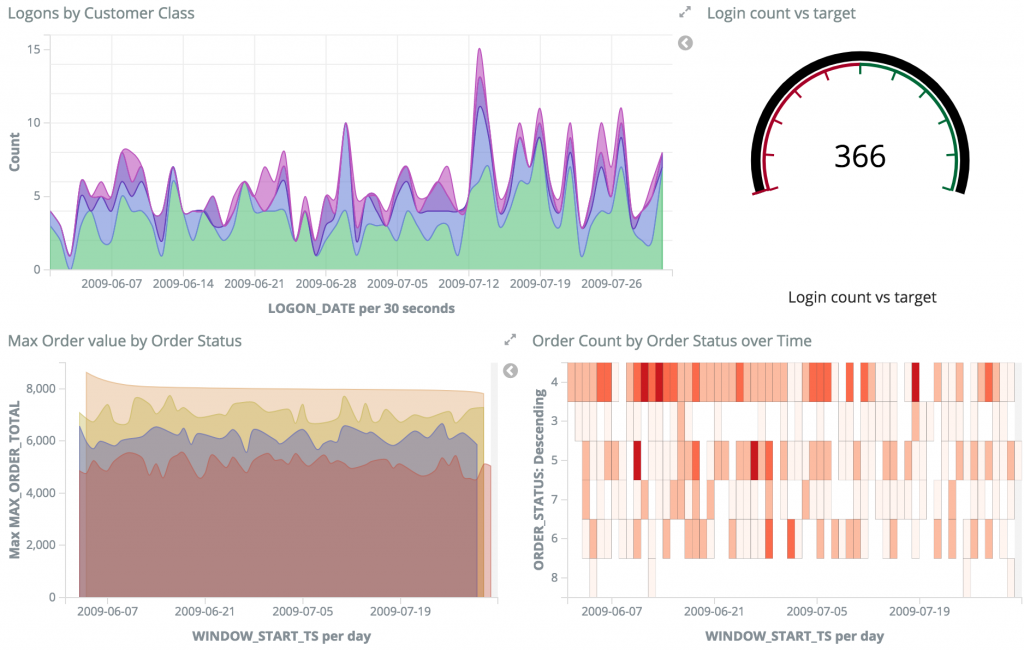
All of this data driven in real time from our source transaction system! Using Kafka we have been able to stream and persist the raw events, transformed and enriched them with KSQL, and streamed to target datastores such as Elasticsearch with Kafka Connect.
ETL Is Dead, Long Live Streams
We’ve seen in this article how we can stream database changes in real-time into Kafka, and use these to drive multiple applications. With KSQL we can easily transform data, from simple filtering of streams of events from a database, to enriching events from multiple sources, denormalizing normalized structures, and creating rolling aggregates. Since KSQL writes transformed streams back to Kafka, we can use predicates in KSQL to easily implement exception detection, driving real-time applications without the need for complex coding. By defaulting to being event-driven, we can build systems that provide data for analytics when it’s needed, and use the same enriched data for driving applications in real-time.
Where To Go From Here
If you have enjoyed this article, you might want to continue with the following resources to learn more about KSQL and Streaming ETL:
- Get started with KSQL to process and analyze your company’s data in real-time.
- Watch our 3-part online talk series for the ins and outs behind how KSQL works.
- Watch Neha Narkhede’s online talk: ETL Is Dead, Long Live Streams.
- Check out our Streaming ETL – The New Data Integration online talk series.
If you are interested in contributing to KSQL, we encourage you to get involved by sharing your feedback via the KSQL issue tracker, voting on existing issues by giving your +1, or opening pull requests. Use the #ksql channel in our public Confluent Slack community to ask questions, discuss use cases or help fellow KSQL users.
이 블로그 게시물이 마음에 드셨나요? 지금 공유해 주세요.
Confluent 블로그 구독
Stop Treating Your LLM Like a Database
GenAI thrives on real-time contextual data: In a modern system, LLMs should be designed to engage, synthesize, and contribute, rather than to simply serve as queryable data stores.
Generative AI Meets Data Streaming (Part III) – Scaling AI in Real Time: Data Streaming and Event-Driven Architecture
In this final part of the blog series, we bring it all together by exploring data streaming platforms (DSPs), event-driven architecture (EDA), and real-time data processing to scale AI-powered solutions across your organization.

