Apache Kafka®️ 비용 절감 방법 및 최적의 비용 설계 안내 웨비나 | 자세히 알아보려면 지금 등록하세요
Journey to Event Driven – Part 4: Four Pillars of Event Streaming Microservices
So far in this series, we have recognized that by going back to first principles, we have a new foundation to work with. Event-first thinking enables us to build a new atomic unit: the event. Storing events in a stream and connecting streams via stream processors provide a generic, data-centric, distributed application runtime that you can use to build ETL, event streaming applications, applications for recording metrics and anything else that has a real-time data requirement.
This model is completely free form, we can build anything provided that we apply mechanical sympathy with the underlying system behavior. It offers time travel, a source of truth, scaling, consistency and many elements that we can rely on. All of these, and more, lead to design patterns that can be used and reused.
Everything is asynchronous; everything is stored; everything is partitioned; everything scales
Overview
- Four pillars of event streaming
- Building the KPay payment system
- Putting it all together
- Parting thoughts and preparing for the future
To read the other articles in this series, see:
- Journey to Event Driven – Part 1: Why Event-First Thinking Changes Everything
- Journey to Event Driven – Part 2: Programming Models for the Event-Driven Architecture
- Journey to Event Driven – Part 3: The Affinity Between Events, Streams and Serverless
It is not uncommon for those embarking on the journey to event-driven, asynchronous architecture to ask:

“Hey, so I’m writing these events, how do I know what’s happening and whether they’re working as intended? I don’t trust my application when it is asynchronous—I really want transactions.”
Let’s explore what this really means. We need to build something real, such as a payment system. Why a payment system, you ask? Well, pretty much every business out there needs to get paid, so it seems like a very common use case. It is easy to understand but also scary for developers who must trust an action that moves money from one account to another only using a transaction.
Transactions give you all or nothing (atomic) behavior. They provide a guaranteed level of trust; they are simple. When we do replace transactions with events, it can seem complicated. Yes, we can transact across partitions in Apache Kafka®, and with traditional database transactions you get many “trust” semantics for free; however, they are pushed down into the database runtime. The problem is that many traditional OLTP databases are also relatively slow when they need to scale. 😉
Not only does the event streaming model expose the developer to building transactional semantics, scaling and error handling, etc., but it also means that they have more control, a richer ability to extend and enrich the system. Although this sounds like it adds complexity, the opposite is true. Following the introduced patterns and working within bounded contexts it actually contains the complexity within each context.
We also have the opportunity to add layers of functionality to the payment system as it evolves. Some banks run up to 30 processing stages, which stretches well beyond the realms of a single, atomic transaction, and pushes the complexity of XA transactions—which don’t exist in the event-driven world.
“We believe that the major contributor to this complexity in many systems is the handling of state and the burden that this adds when trying to analyse and reason about the system” [emphasis added].
The most challenging goal of any application architecture is simplicity, but it is possible to achieve. I’m going to explore four pillars for enabling scalable development that works across the event-driven enterprise. These pillars minimize complexity and provide foundational rules for building systems using composition. To wrap it up, I’ll touch on the natural progression of the payment system, including enterprise adoption, events as a backbone and DevOps.
Four pillars of event streaming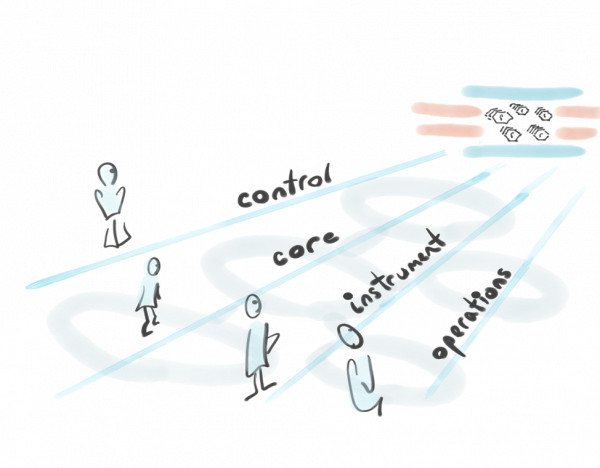
Recognizing architectural pillars and patterns allows us to move away from complexity.
To adopt event-first thinking, we need to stop, take a breath and deeply understand the world of transaction processing, which we often take for granted, and then map its mechanics to the event-driven streaming world. (Note: We view event streaming as the next generation of event driven.) There are many orthogonal concepts we also need to understand, let alone the core business function of moving the money: How much money is being transferred? What is the latency? How do I upgrade or evolve microservices? Can I scale it up and down? What happens to bad payments? Can it be extended for different payment types? Which teams are going to run my system? Where is it going to run?
For this reason, I’m not only going to focus on the payment processing pipeline but also work through the other functionality required to architect a production-worthy solution. By nature anything that is event driven provides loose coupling. With event-first design, the data becomes the API which, like any production system, needs to support change and evolution (i.e., Avro or Protobuf). Furthermore, in embracing loose coupling, we inherit a clean separation of concerns (SoC), which provides the ability to develop and operate various aspects of the system architecture independently.
These aspects can be organized into a set of complementary pillars:
- Business function: The payment processing pipeline
- Instrumentation plane: How much money is transferred? How quickly are payments processed?
- Control plane: Patterns to start, stop, pause, coordinate and autoscale
- Operational plane: Dead letter queues (DLQs), error tracking & handling, logging and NoOps
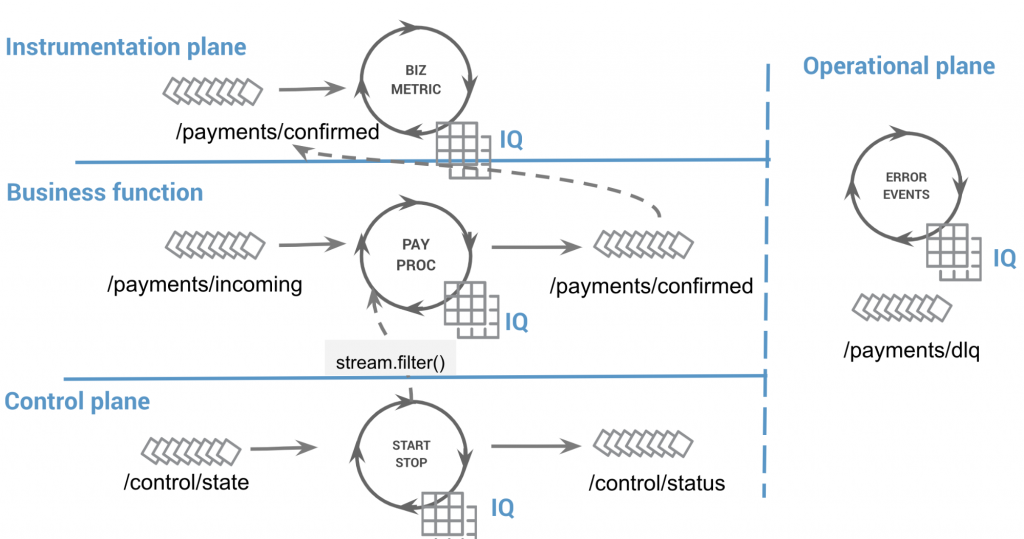
The four pillars of event streaming architecture applied to our system, details excluded
1. Business function
The business function represents the core functionality being built. It provides business value that is immediate and beneficial to the organization. Examples include payment processing, logistics, data processing (ETL) and so on. This function can be developed as a set of events and related dataflows across one or more bounded contexts.
2. Instrumentation plane
The role of the instrumentation plane is to capture metrics that prove that the business function is performing sufficiently. Metrics may have a variety of uses—they might be used to drive alerts, assist in capacity planning or drive infrastructure automation functions such as auto-scaling.
In our case, business level monitoring is the ability to track metrics such as, payments in progress, failed payments and payment throughput. These could also be mapped onto application metrics, including the supporting dataflow volume, latency tracking and throughput. In the next level down, they can be mapped to the underlying broker infrastructure metrics, such as consumer lag, throughput per topic and partition hotspots, in addition to operating system metrics like CPU, network I/O, disk I/O, load average, etc.
3. Control plane
An often overlooked aspect of many systems is its ability to control the flow of events. Unlike batch systems, event streaming applications continuously process data. This means that while it might be possible to perform rolling upgrades, the system sometimes needs to halt processing, perform an action, such as an upgrade or logic change, and then resume processing. The control plane becomes essential when outages have occurred and a large-scale system must get back online in a coordinated fashion, perhaps with incremental, restricted functionality.
In the context of a payment system, you might need to drain the current set of payments for a topology change. But what if there is a regional outage—how do you bring the system back online without overloading downstream systems?
4. Operational plane
Developing the system for the “happy path” is easy—it’s catering for the remaining paths when simplicity can become compromised. Relying on pushdown semantics of container “restart on failure,” workload feedback cycles to drive elasticity and other underlying functionality—we need to understand all of this and more. We need to build a model for capturing operational processes, such as rolling restarts and wipe and update processes, and develop these in automation scripts to drive the infrastructure automation.
Ansible has emerged as a leading automation language and provides a wide range of plugins for configuration management, orchestration as well as anything else that might be needed when working with physical servers. For those with a Kubernetes ecosystem, the use of Helm, Helm Charts and Operator scripts is quite popular.
The most important aspect of operations is not that you have dead letter queues or the like, but rather that you have trusted processes. These processes must be deterministic; they must be reliable. The only way of validating operational processes is to use automation and testing. Testing requires appropriate instrumentation that serves as a validation mechanism. Testing operational processes becomes a lot easier when the systems being operated are decoupled and, most importantly, have all its events captured in Kafka. This means that Kafka is used not only to store and emit events but also playback scenarios, so you can pinpoint when things started going wrong.
Building the KPay payment system
KPay is a demonstration application that shows how to apply our event streaming pillars. It is a fully functioning payment system, providing a user interface (pictured below), a web tier, a series of Kafka Streams processors as well as a payment generator for load testing. The payment generator and other parts of the web interface are exposed using Swagger (also pictured below). The source code is comprised of the following packages that map onto the pillars:
- payments: the business function of payment processing
- metrics: the instrumentation plane to monitor payment throughput and latency
- control: the control plane to stop and start payment processing
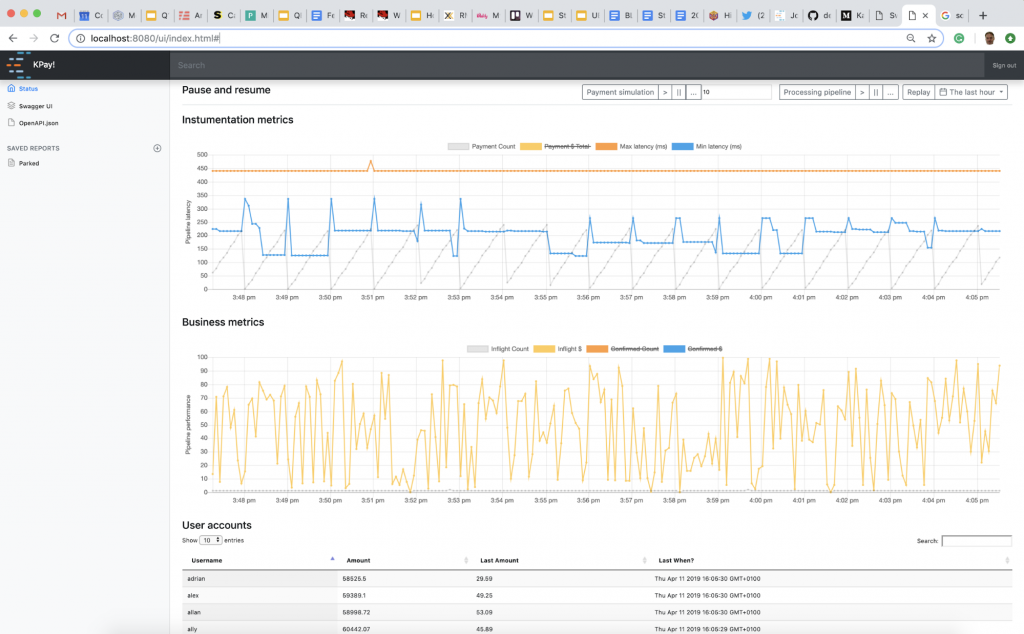
The KPay user interface
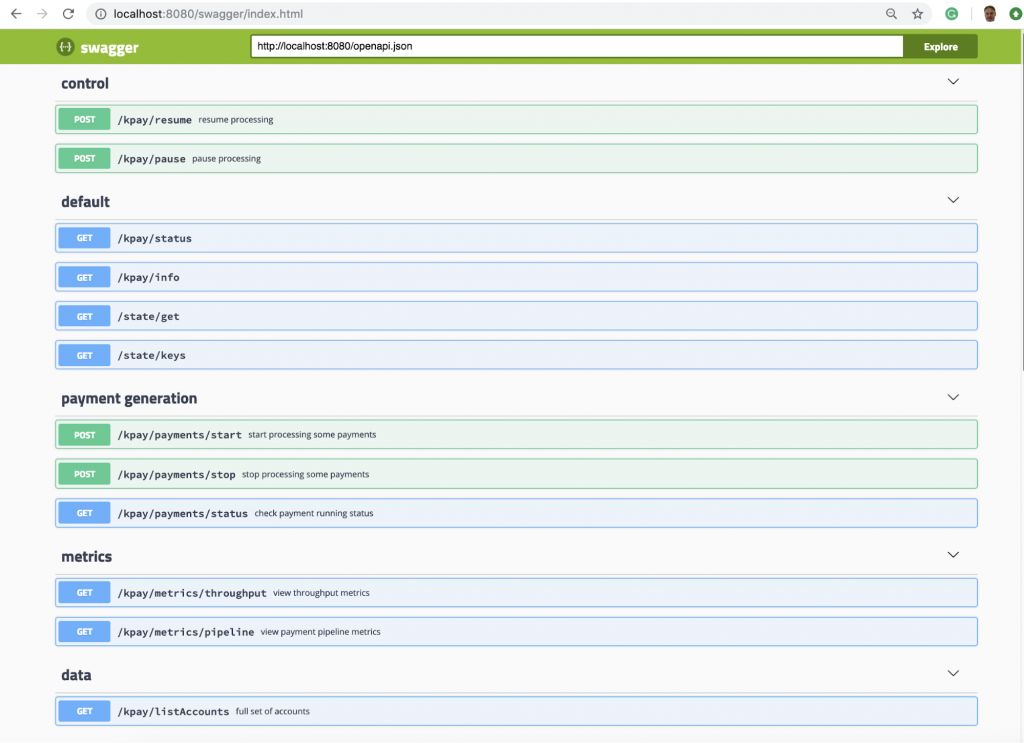
Swagger is used to document the REST interface and expose the control plane.
KPay leverages Kafka Streams and the various utilities it provides. These include materialized views called KTables, where the collected state is natively backed by a Kafka topic called a changelog stream. Thus, Kafka Streams KTables also benefit from the scaling model provided by Kafka partitioning.
Kafka Streams processors are commonly called applications, because they are provided as a library and can be run within an application, or in a cluster using a technology of choice (Docker, naked Java processes, etc.). Another benefit of Kafka Streams is that a KTable will emit change-data-capture (CDC) events through a connector (say Elasticsearch) to an external datastore, allowing it to act as a view layer. This mechanism separates the write path from the read path and is called command-query separation (CQRS). Alternatively, we can query the KTables directly using interactive queries, also known as turning the database inside out. I will discuss the second approach later on in this blog post.
Pillar 1 – Business function: Payment processing pipeline
Payment processing is an interesting problem. In addition to being deterministic, reliable, idempotent and scalable, more importantly, it can be user driven or machine driven. In either case, there can be challenges relating to latency and scale. Latency, where person X gets frustrated at the “busy spinner” and clicks a back button on a webform, or perhaps the purchase of a major sporting event ticket leads them to an error page—did they take my money or not? For synchronous machine-driven payments, clients latency can have a significant knock-on effect. It can force systematic retries or timeouts. If the client supports asynchronous interaction, be it machine or human, then the solution becomes simpler.
Goal
To handle millions of payments
Requirements
Although I normally write these as user stories, I’m just going to cut to the chase with a collection of fictional requirements. The system needs to report how much money is inflight, process both sides of the payment and also confirm the total amount of payments successfully processed. In other words, it must:
- Scale to millions of payments
- Perform asynchronous processing
- Track payments inflight (total value of payments being processed)
- Remove/debit money from an account when handling a debit event
- Add/credit money to an account when handling a credit event
- Track payments confirmed today (total value of payments successfully processed)
Event flow model
The payment processing pipeline is an event streaming dataflow that uses a series of Kafka Streams applications for each stage. Each stage performs a specific function, to track a payment, update a balance, etc.
![1. Payments Inflight | 2. Account Processor [from] | 3. Account Processor [to] | 4. Payments Conf'd](https://cdn.confluent.io/wp-content/uploads/Payment_Processing_Pipeline-1024x510.png)
Payment processing pipeline
Let’s walk through the flow of the above diagram:
- Payment requests flow from the payment.inflight topic into the payments inflight processor. It updates the total balance of payments currently being processed, similar to a read-uncommitted view. It sends the payment request into the payment.inflight topic, keyed by the from account and setting the event type to DEBIT.
- An account processor receives the DEBIT request, validates that the payment can be processed and updates the user’s balance (KTable). It then emits another event, keyed against the to account, and sets the event type to CREDIT.
- Another account processor receives the CREDIT event, updating the user’s balance in the KTable and emitting the payment-complete event.
- The payments conf’d processor updates the total confirmed balance, which is similar to the read-committed value.
The account processors (from 2 and 3) handle both sides of the payment (debit and credit). Depending on the event.key, Bob and Alice may or may not be handled by the same instance.
Event flow breakdown
1. Payments inflight
Payments inflight acts as a gateway for the business flow. Its responsibility is to track business-level metrics that are important to application users, including the total payment value inflight and the number of payments currently being processed.In contrast, instrumentation metrics relate to the application support team and might include latency percentiles, payment throughput and outliers.
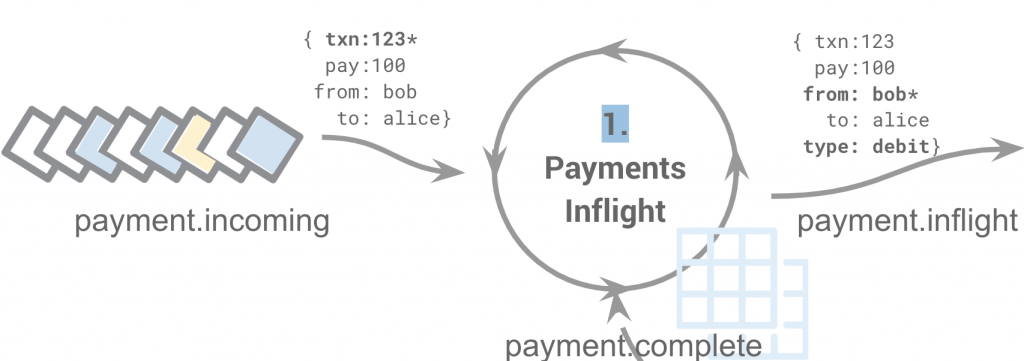
The payment is received on payment.incoming, the total payment amount inflight, and an output event is emitted onto payment.inflight. When a payment was received from payment.complete and has a status of payment.state.complete, then the payment value is removed.
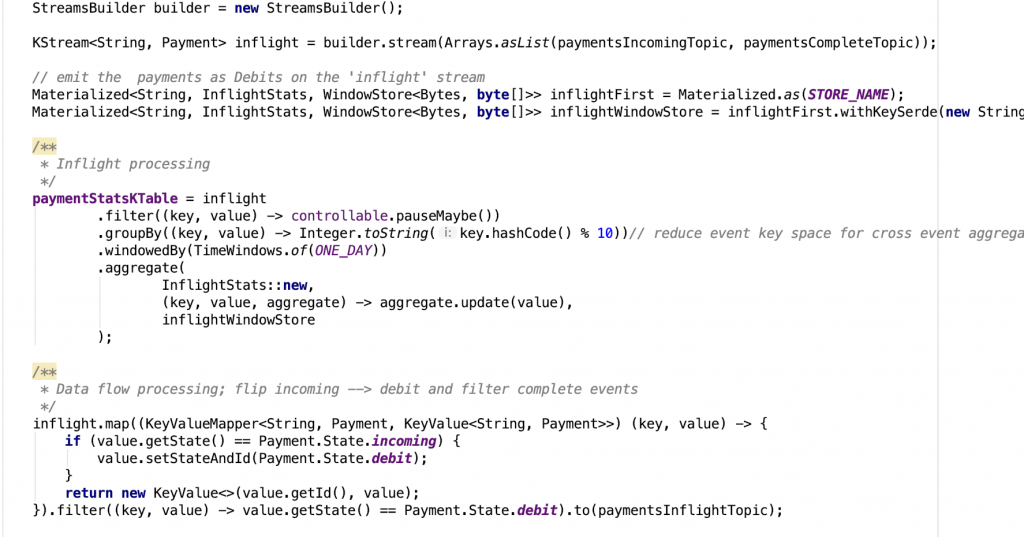
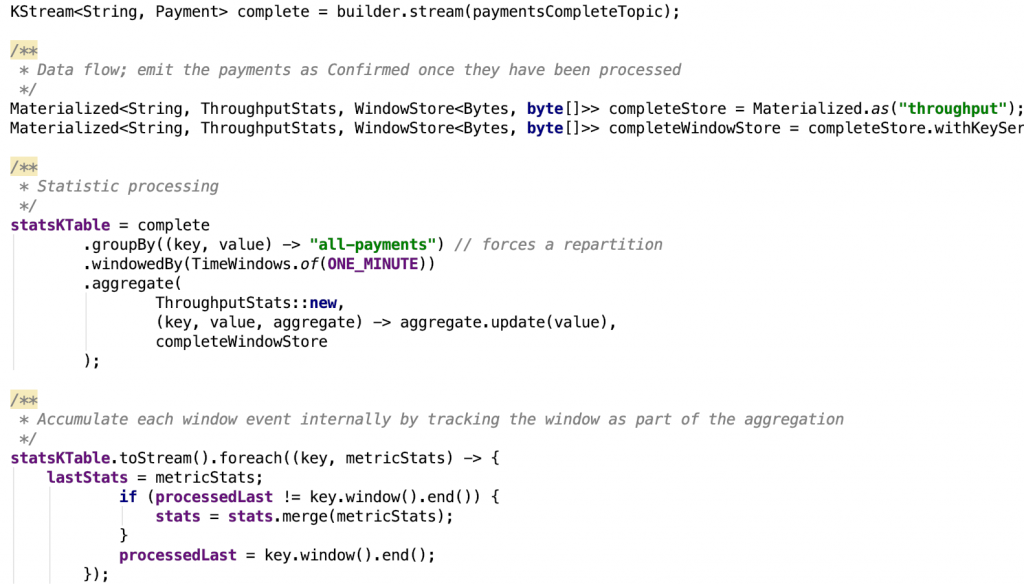
The code below shows the payments inflight processor and the inflights aggregator class that maintains the state. It updates the account balance according to debit or credit payment.state. Notice how the processor has two parts: one for the statistical aggregation and another to rekey and emit the payment event to the payment.inflight topic.

2–3. Account Processor
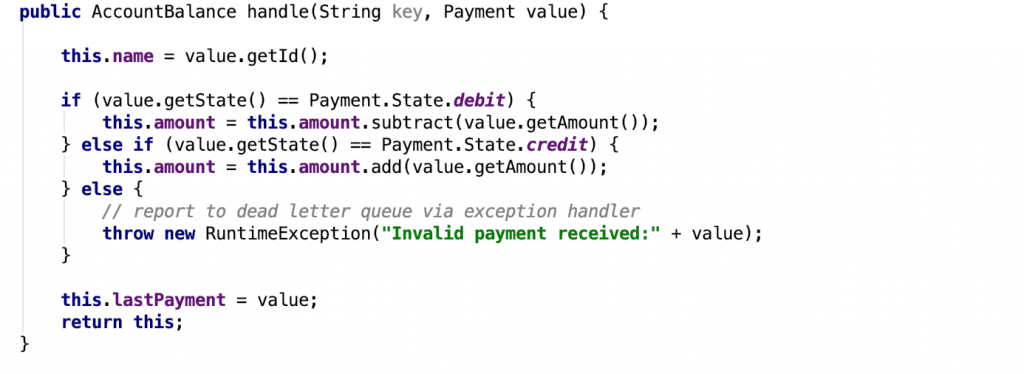
The account processor maintains the value of a user’s account by handling debit and credit payments. Depending upon the type of payment being processed, a subsequent payment event will be emitted to the payment.inflight or payment.complete topic. Interactive queries display the AccountBalance values through the user interface.
In this case, the code uses a generic set of classes to expose the information via REST. The alternative approach is to use CQRS, where the KTable’s changelog event stream is used to project account balances into a viewing service like Elastic, Cassandra or something similar. Note: The default behavior of a KTable is to emit changelog events.
![payment.inflight → 2. Account Processor [from] → payment.inflight → 3. Account Processor [to] → payment.complete](https://cdn.confluent.io/wp-content/uploads/Account_Processor-1024x277.png)
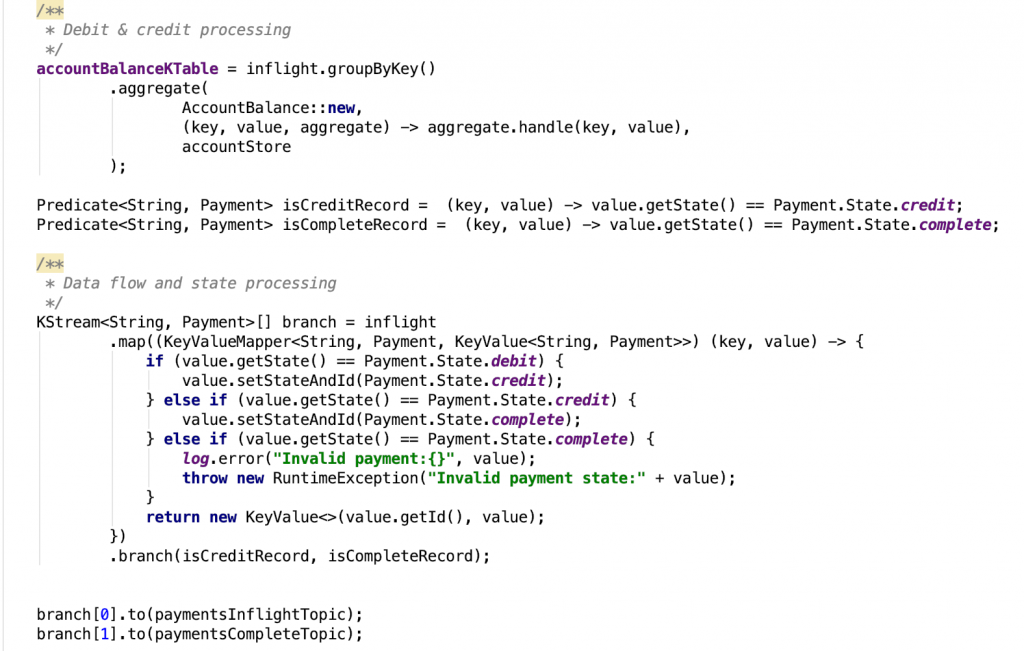
The code below shows the AccountProcessor followed by the AccountBalance aggregator. Of the two branches within this topology, one maintains state via the AccountBalance aggregator (.groupByKey), and the other routes payment based upon the State (isCreditRecord or isCompleteRecord) .map.
4. Balance confirmed
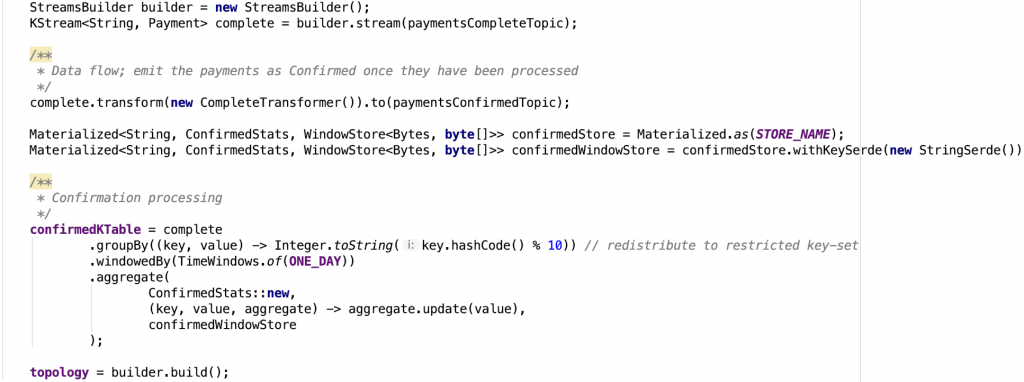
The final stage is confirmation. Payments emitted from this stage have been successfully processed.
Scaling model and limitations
Notice how the above code reduces the key space of the groupBy(key). Rekeying using values 0–9 will distribute the payments to an intermediate topic across a limited set of partitions (the topic should be configured with 10 partitions). The purpose is to allow multiple consumers to aggregate their allocated set of partition data. If there is a single Kafka Streams processor, it will receive all partitions; however, as more are added, the data will balance across them according to the consumer group protocol. Aggregation is performed on a per-key basis, so there will only be 10 ConfirmedStats instances.
The data serving layer: Interactive queries and materialized views
The ability to maintain real-time data across a series of stateful, stream processing microservices is very powerful, but how do we make that state accessible? How do we see how much money is in each person’s account and serve data to interested clients? In order to access stateful data, you can either use CQRS by emitting CDC events to an external datastore, such as Elastic, or query the KTable directly. I will focus on the latter.
Kafka Streams supports materialized views similar to a relational table, albeit with a key-value (KV), iterator-style API. This model is called interactive queries, or queryable state/tables, and it provides just enough scaffolding for the user to leverage their preferable networking layer, whether it’s gRPC or REST. KPay uses interactive queries extensively to provide state for the rendering of account balances, business metrics and instrumentation metrics, among other activities.
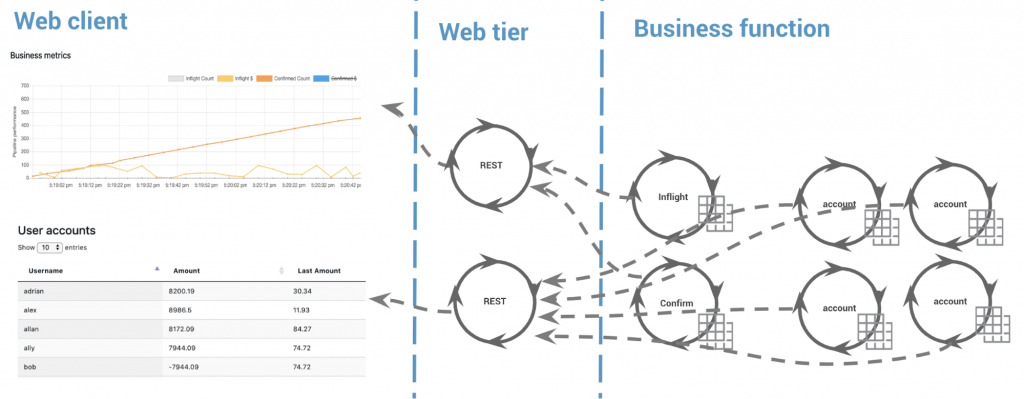
KTable state (live account balances per user in this example) is exposed to the web tier using interactive queries.
Kafka Streams interactive queries scaffolding
Kafka Streams provides an endpoint-agnostic means to building your own interactive queries layer. This supports real-time discovery of endpoints as processors scale up or down.
The approach is straightforward, relying on a GlobalKTable to share application endpoint information between instances of the same application ID. Like regular KTables, they are backed by a changelog topic. When a KTable is created, the store name and endpoint address are specified and published as StreamsMetadata. The endpoint information is available to all remote Kafka Streams contexts using the MetadataService that queries the KStreams.allMetatadata().
KPay interactive queries: KTables
The REST interactive queries layer that I’ve developed is extremely simple and reusable. It relies on class introspection to minimize the amount of boilerplate code required. Feel free to test drive the simplified tests and then dive into the code.
To build a discoverable REST endpoint for a KTable or WindowedKTable, implement code similar to the following:

The WindowKTableResourceEndpoint class introspects the provided KTable’s generic parameters to construct the REST endpoint, which is then available to drive via Swagger. The client side of the REST service uses these classes within the KTableRestClient to discover and access remote instances.
The following code is used to create a client that queries each remote AccountProcessor endpoint to obtain the live balance of user accounts. It shows how to request the full set of account keys as a Set<String> and then retrieve the set of account balances.

The KTableRestClient lists all accountKeys and then fetches accountBalances.
Enhancements
The purpose of the demo is to demonstrate the four key architectural principles in practice. It can be improved with regard to:
- Error handling: Implement sagas to handle unwinding on failed payments, perhaps when corrupted or fraudulent activity is detected
- Pre-payment validation: Add a preliminary stage to support scenarios such as detecting and handling suspicious or fraudulent activity
- Restrict dependent payments: When it makes sense, only allow a single debit payment for a single account to be inflight at any point in time
- Limits: Introduce limit checks against accounts with low balances
Pillar 2 – Instrumentation plane: Business metrics
There are a plethora of monitoring tools that provide valuable functionality. Most of them are great for bottom-up metrics or infrastructure metrics.
Operating system and application infrastructure metrics are useful for overall knowledge, but the most important question to answer is: Am I meeting business goals?
The goal for our instrumentation plane is tracking business metrics. We need to know with certainty that the system is performing correctly and how system performance impacts the business. Are our users happy? Are we responding quickly enough to meet demand? Behavioral problems can often be identified through these business metrics because they tend to result from a repeated series of underlying interactions that comprise the function, the flow of events. Another aspect is that business metrics can be used to drive adaptive behavior. Examples include scaling up the processing capability, applying backpressure and modifying system SLAs.
Goal
To meet the system’s business goals
Requirements
Let’s assume we have the following requirements, some of which should be quite obvious:
- Process payments in < 200 milliseconds (latency)
- Throughput > 1,000 per second
- Report the total count and dollar amount (the demo code uses a one-minute window)
Event flow model
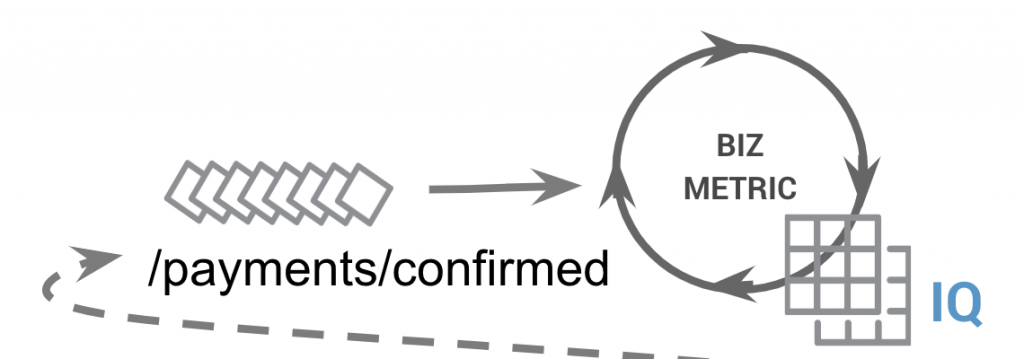
The instrumentation flow model is a single stream processor that uses the timestamp information of each payment to drive an aggregator. Latency is measured by the timedelta between the current time and the timestamp set by the payments inflight processor.


The user interface rendering throughput statistics
Pillar 3 – Control plane: Flow control, start, pause, bootstrap, scale and rate limit
The last pillar of the event streaming architecture is the control plane, which drives and coordinates the system. The demo allows you to halt and resume the processing of payments, in which the former is particularly valuable because it allows the pipeline to complete inflight processing. This essentially provides a flush (or drain) of the current set of inflight payments, which can be useful when there is a topology or logic change.
It should be noted that when changing an event stream’s topology, the intermediate topics may have a different structure. It is not always a straightforward upgrade path. This kind of functionality can also be leveraged to redirect flow onto a new set of processors, or drive A/B processing or an upgrade path. For example, when a topology change occurs, the current pipeline is halted and flushed, state stores are backed up and state is migrated to new instances that take over processing. The new instances prepopulate the backed-up state, and then processing is resumed.
Goal
To pause and resume payment processing
Requirements
- Pause processing and allow existing payments to be completed (drained)
- Resume processing from the paused state
Event flow model

The StartStopController shown below handles start/pause events that drive a callback to pause() and resume() methods. The methods call back onto a Controllable instance injected at creation time. The basic implementation uses object.wait and notify methods as seen in PauseControllable.

The PauseControllable passes into the entry point for the payment processing pipeline, the InflightProcessor. It then interacts with the event stream’s .filter() call as shown below.

PaymentsInflight.java uses a filter() to pause processing.
This particular approach is abstracted away via the controller interface. The downside is that we have introduced interface coupling between the business and control plane. An alternative approach is to introduce a gated processor that controls the flow of events into another topic. The downside of the gated approach, however, is that it incurs another Kafka topic.
Pillar 4 – Operational plane: Event logging, DLQs and automation
Operations aren’t a new concept; however, the new age of NoOps, configuration management and automation, etc., encompasses operational concerns under the banner of DevOps. I will provide a view operational dataflows that can be used to support this pillar. To state the obvious, the operational plane is entirely dependent on the instrumentation plane for observability and the control plane for coordination. Operational aspects include, upgrade processes, 24×7 runtime support, evolutionary support (e.g., new processors or data evolution) and, of course, the infrastructure to handle normal operations. The dataflow patterns normally introduced are summarized below:
- Application logs: Each microservice will use a log appender to selectively send log messages to a specific topic that is relevant to the application context. The log message will also contain metadata about the runtime, perhaps including the input topic and output topic, consumer group as well as the source event information. These logs are relevant to business events and should be tied to the bounded context.
- Error/warning logs: Similar to above, but the focus is on error/warning log events and sending to the relevant topic. It is also useful to build a log context that accumulates relevant information to enrich the log message if an error/warning does occur.
- Audit logs: Each microservice will capture a security context (e.g., user, group, credential or reason) as well as event context (i.e., event ID, event origin, source and destination topic) and emit to a relevant, contextually determined audit log topic.
- Lineage: Similar to above, except that the event will contain trace information about its journey—for example, each processor, or the context it has accessed or modified on its dataflow.
- Dead letter queues: These provide a place to store raw events that cannot be processed. Processing failure can be due to any number of reasons, from deserialization failure to invalid values or invalid references (join failure, etc). In any case, the purpose of dead letter queues is to make you aware of the error so you can fix it. The dead letter queue is the last line of defense and might indicate a failing CI/CD process, in which a scenario has occurred that was not catered for. The dead letter queue should always be empty. In some cases, a saga pattern is needed to unwind the preceding state that caused the error. Remember, events must be processed idempotently.
These patterns all need to be associated with the bounded context in which they occur.
Putting it all together
The quick and lazy version of running the demo is within your IDE (captured below).To run it in a more robust manner, you can Dockerize the relevant components. Each stream processor and the web tier contain their own main() method. The main() method can be used to run the appropriate class within the Docker image. To see how all stream processing microservices run within a monolith, refer to KPayAllInOneImpl.
Run the payment system within your IDE:
-
-
- git clone git@github.com:confluentinc/demo-scene.git
- Run IntelliJ, then open ./scalable-payment-processing/ and import the maven.pom file
- Run/debug the RestEndpointIntegrationTest.runServerForABit()
- Point the browser to http://localhost:8080/ui/index.html#

- The Swagger interface is available at http://localhost:8080/swagger/index.html. It exposes the REST API and JSON data model.

-
Deployment model
If you choose to run the payment system within Kubernetes and Docker, each plane ends up running separately. In the deployment below, four account processors are running. The web tier queries each AccountProcessor using the stream.metadata to interact with each instance as a KV store and returns the JSON data for rendering in the browser.
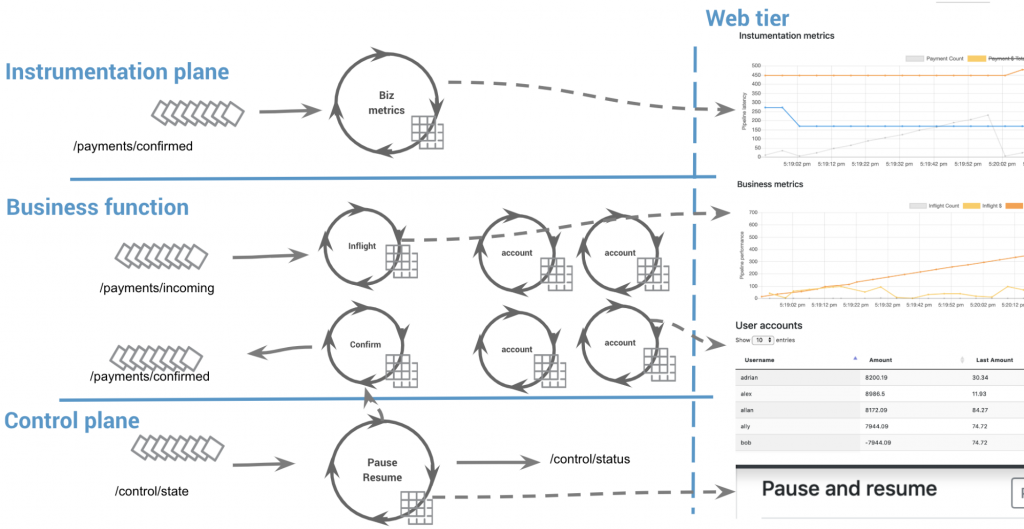
There are, of course, many shortcuts being made in the code base. Here are the most obvious ones:
- Event objects are exposed through the web tier. This is bad, because they need to be contained within the bounded context. There should be a translation layer into POJOs to support evolvability that is independent between the web clients and the bounded context. In short, don’t bleed the domain model (events) outside of a bounded context.
- There is virtually no error handling, though we need dead letter queues, error queues and saga implementation and handling.
- There is no configuration or environmental management to support automation, which is required for topic configuration, broker connectivity, security and so on.
- There is a lack of versioning.
In the near future, we will be merging KPay into the existing streaming microservice demo ecosystem.
Parting thoughts and preparing for the future
The “software crisis” was first identified in 1968 [NR69, p70] and in the intervening decades has deepened rather than abated.
I started this post by talking about complexity. Complexity in system design is inevitable in any serious, large-scale system. To tackle complexity, you need control. To have control, you need to observe. To observe, you need to instrument. While control, observability and instrumentation are commonplace in many traditional systems, their implementation is subtly different in the world of events. We demonstrated this by reimagining a traditional payment system as a set of discrete stream processors. We saw how, despite being stateful, such a system could be scaled to accommodate digital-native workloads. Moreover, we saw how to layer control and observability over systems of this type, identifying four key pillars in the process—pillars that not only apply to payment processing but also to any event streaming system we may choose to build. These pillars are:
- Core business flow: business functionality
- Instrumentation plane: metrics and observability
- Control plane: start, stop and scale
- Operations plane: application support, error handling and dead letter queues
When the composition approach is applied across the organization, we start getting into the realms of events as a backbone and governance models and more. To support all of it, we really need a strong DevOps story.
The natural next step in this journey is for these pillars to push into the language and runtime environment. Instrumentation, control planes and elasticity become part of the language runtime which, at deploy time, figures out: where the dataflow is going to run, which cloud, container or FaaS. The choreographed dataflow that captures the bounded context becomes how you think about business functions connected through orchestration.
It feels like the last 30 years of distributed systems have left a trail of unloved technology scattered down a dirt track, and only now we’ve started building distributed systems the right way. Through this series, I wanted to explain why you should build applications using event streaming, and why it’s the right approach when others have failed.
Part 1 highlighted the value of questioning the status quo, hence the title. Part 2 reasoned about why using an event streaming platform provides everything you need to build large-scale, event streaming and stateful applications, without most of the “microservicey” legacy frameworks. The goal is essentially to keep it simple and not boil the ocean. In part 3, I really felt like FaaS or serverless functions needed a place to exist, and showed how they are complementary to the event streaming application. And finally, here in part 4, we connected all of the dots and demonstrated how to think about the architecture, using composition and patterns to control complexity in order to build applications at any scale.
I hope you have enjoyed the journey so far. Stay tuned while we continue to stand on the shoulders of giants.
Interested in learning more?
If you’d like to know more, you can download the Confluent Platform, the leading distribution of Apache Kafka.
Other articles in this series
이 블로그 게시물이 마음에 드셨나요? 지금 공유해 주세요.
Confluent 블로그 구독
Unlocking Data Insights with Confluent Tableflow: Querying Apache Iceberg™️ Tables with Jupyter Notebooks
This blog explores how to integrate Confluent Tableflow with Trino and use Jupyter Notebooks to query Apache Iceberg tables. Learn how to set up Kafka topics, enable Tableflow, run Trino with Docker, connect via the REST catalog, and visualize data using Pandas. Unlock real-time and historical an...
Shifting Left: How Data Contracts Underpin People, Processes, and Technology
Explore how data contracts enable a shift left in data management making data reliable, real-time, and reusable while reducing inefficiencies, and unlocking AI and ML opportunities. Dive into team dynamics, data products, and how the data streaming platform helps implement this shift.

