[Virtual Event] GenAI Streamposium: Learn to Build & Scale Real-Time GenAI Apps | Register Now
Monitoring Your Event Streams: Integrating Confluent with Prometheus and Grafana
Self-managing a highly scalable distributed system with Apache Kafka® at its core is not an easy feat. That’s why operators prefer tooling such as Confluent Control Center for administering and monitoring their deployments. However, sometimes, you might also like to import monitoring data into a third-party metrics aggregation platform for service correlations, consolidated dashboards, root cause analysis, or more fine-grained alerts.
If you’ve ever asked a question along these lines:
- Can I export JMX data from Confluent clusters to my monitoring system with minimal configuration?
- What if I could correlate this service’s data spike with metrics from Confluent clusters in a single UI pane?
- Can I configure some Grafana dashboards for Confluent clusters?
Then this two-part blog series is for you:
- Monitoring Your Event Streams: Integrating Confluent with Prometheus and Grafana (this article)
- Monitoring Your Event Streams: Tutorial for Observability Into Apache Kafka Clients
Confluent Control Center provides a UI with “most important” metrics and allows teams to quickly understand and alert on what’s going on with the clusters. Prometheus and Grafana, on the other hand, provide a playground for creating dashboards pertaining to ad hoc needs, with aggregations from various systems. This post is the first in a series about monitoring the Confluent ecosystem by wiring up Confluent Platform with Prometheus and Grafana.
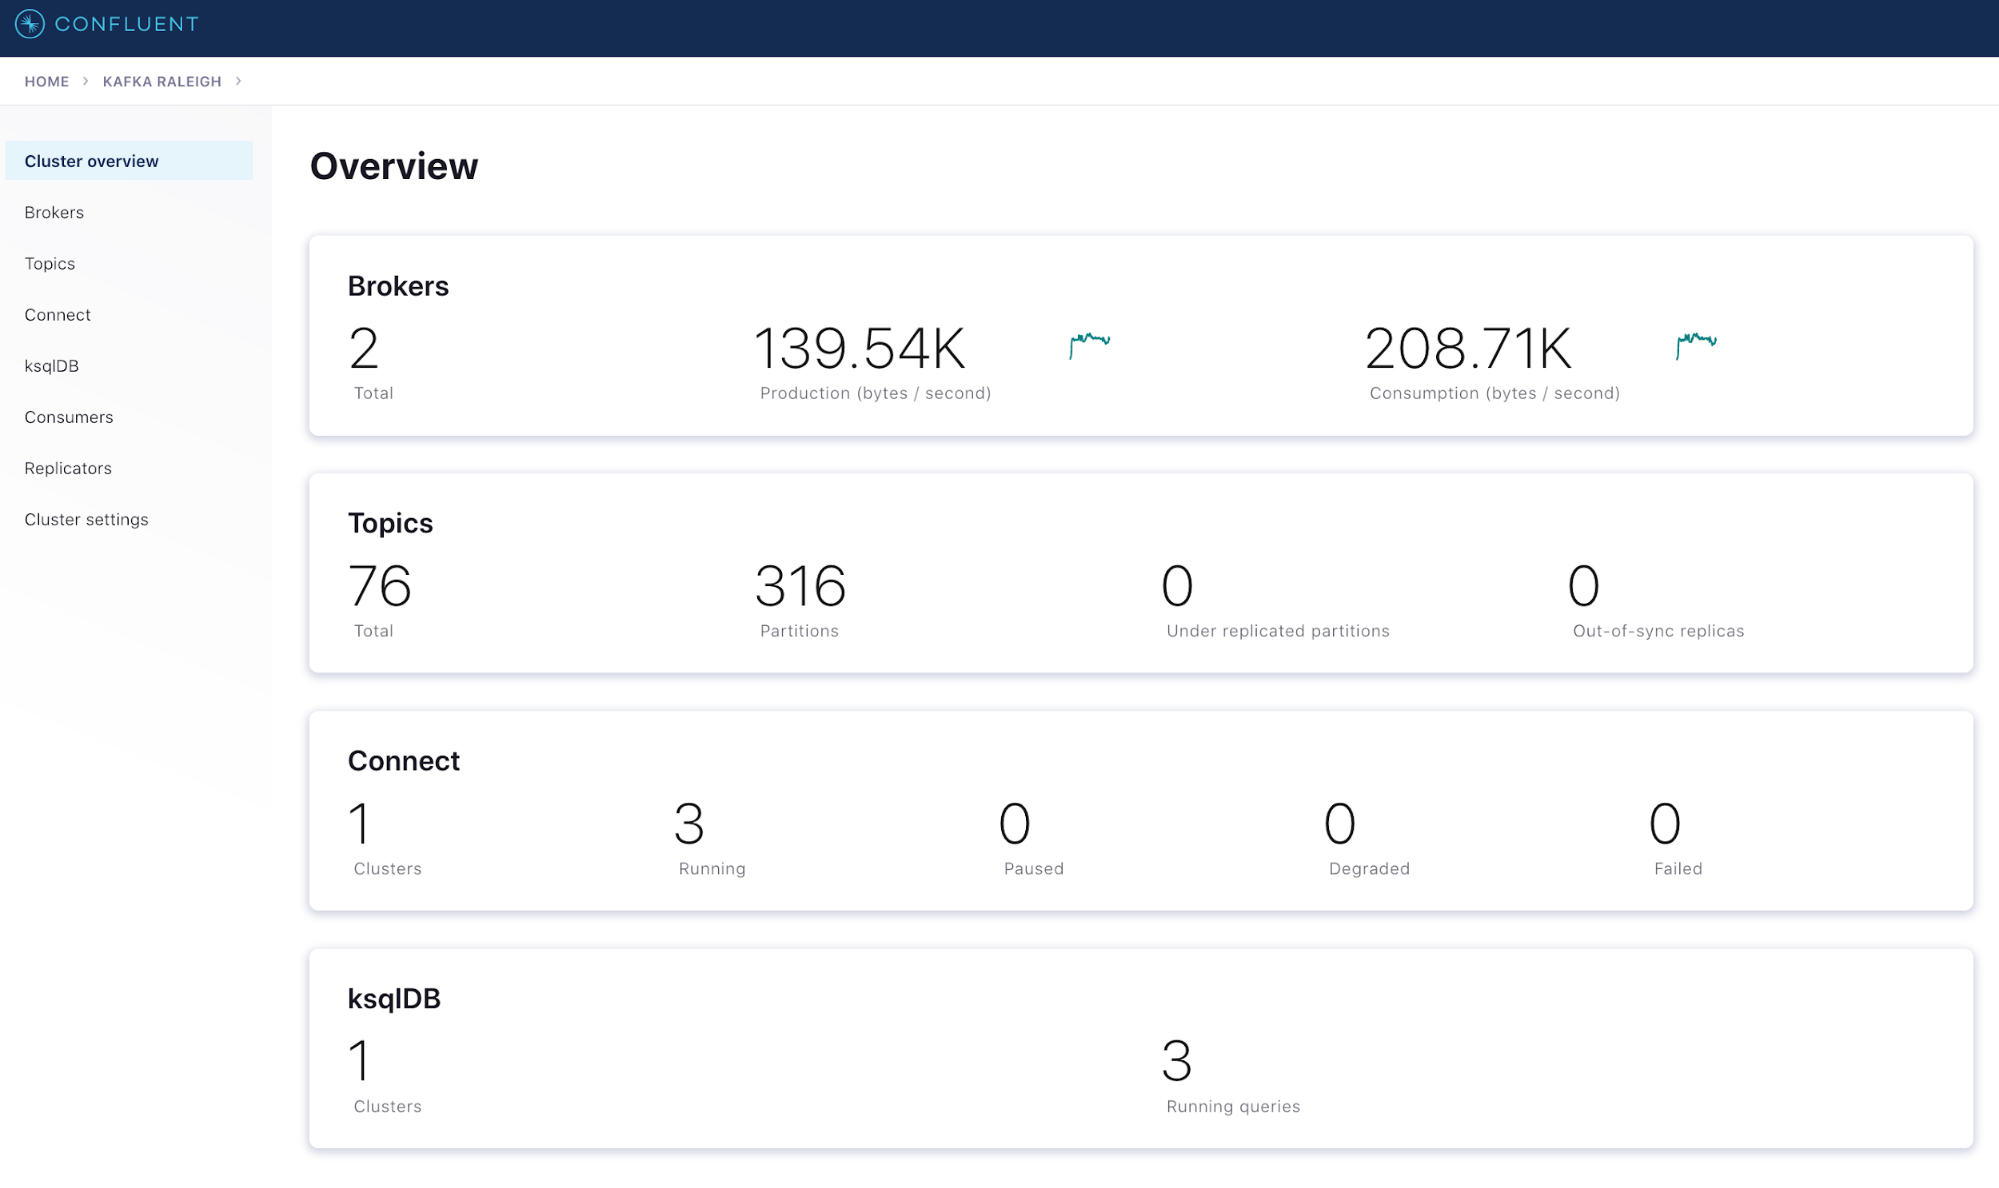
Below, you can see some examples of using Confluent Control Center. Control Center functionality is focused on Kafka and event streaming, allowing operators to quickly assess cluster health and performance, create and inspect topics, set up and monitor data flows, and more.
- The “Cluster overview” panel provides a summary of the most important metrics at the cluster level: total brokers, cluster throughput rates, health of ksqlDB and Kafka Connect clusters, etc.
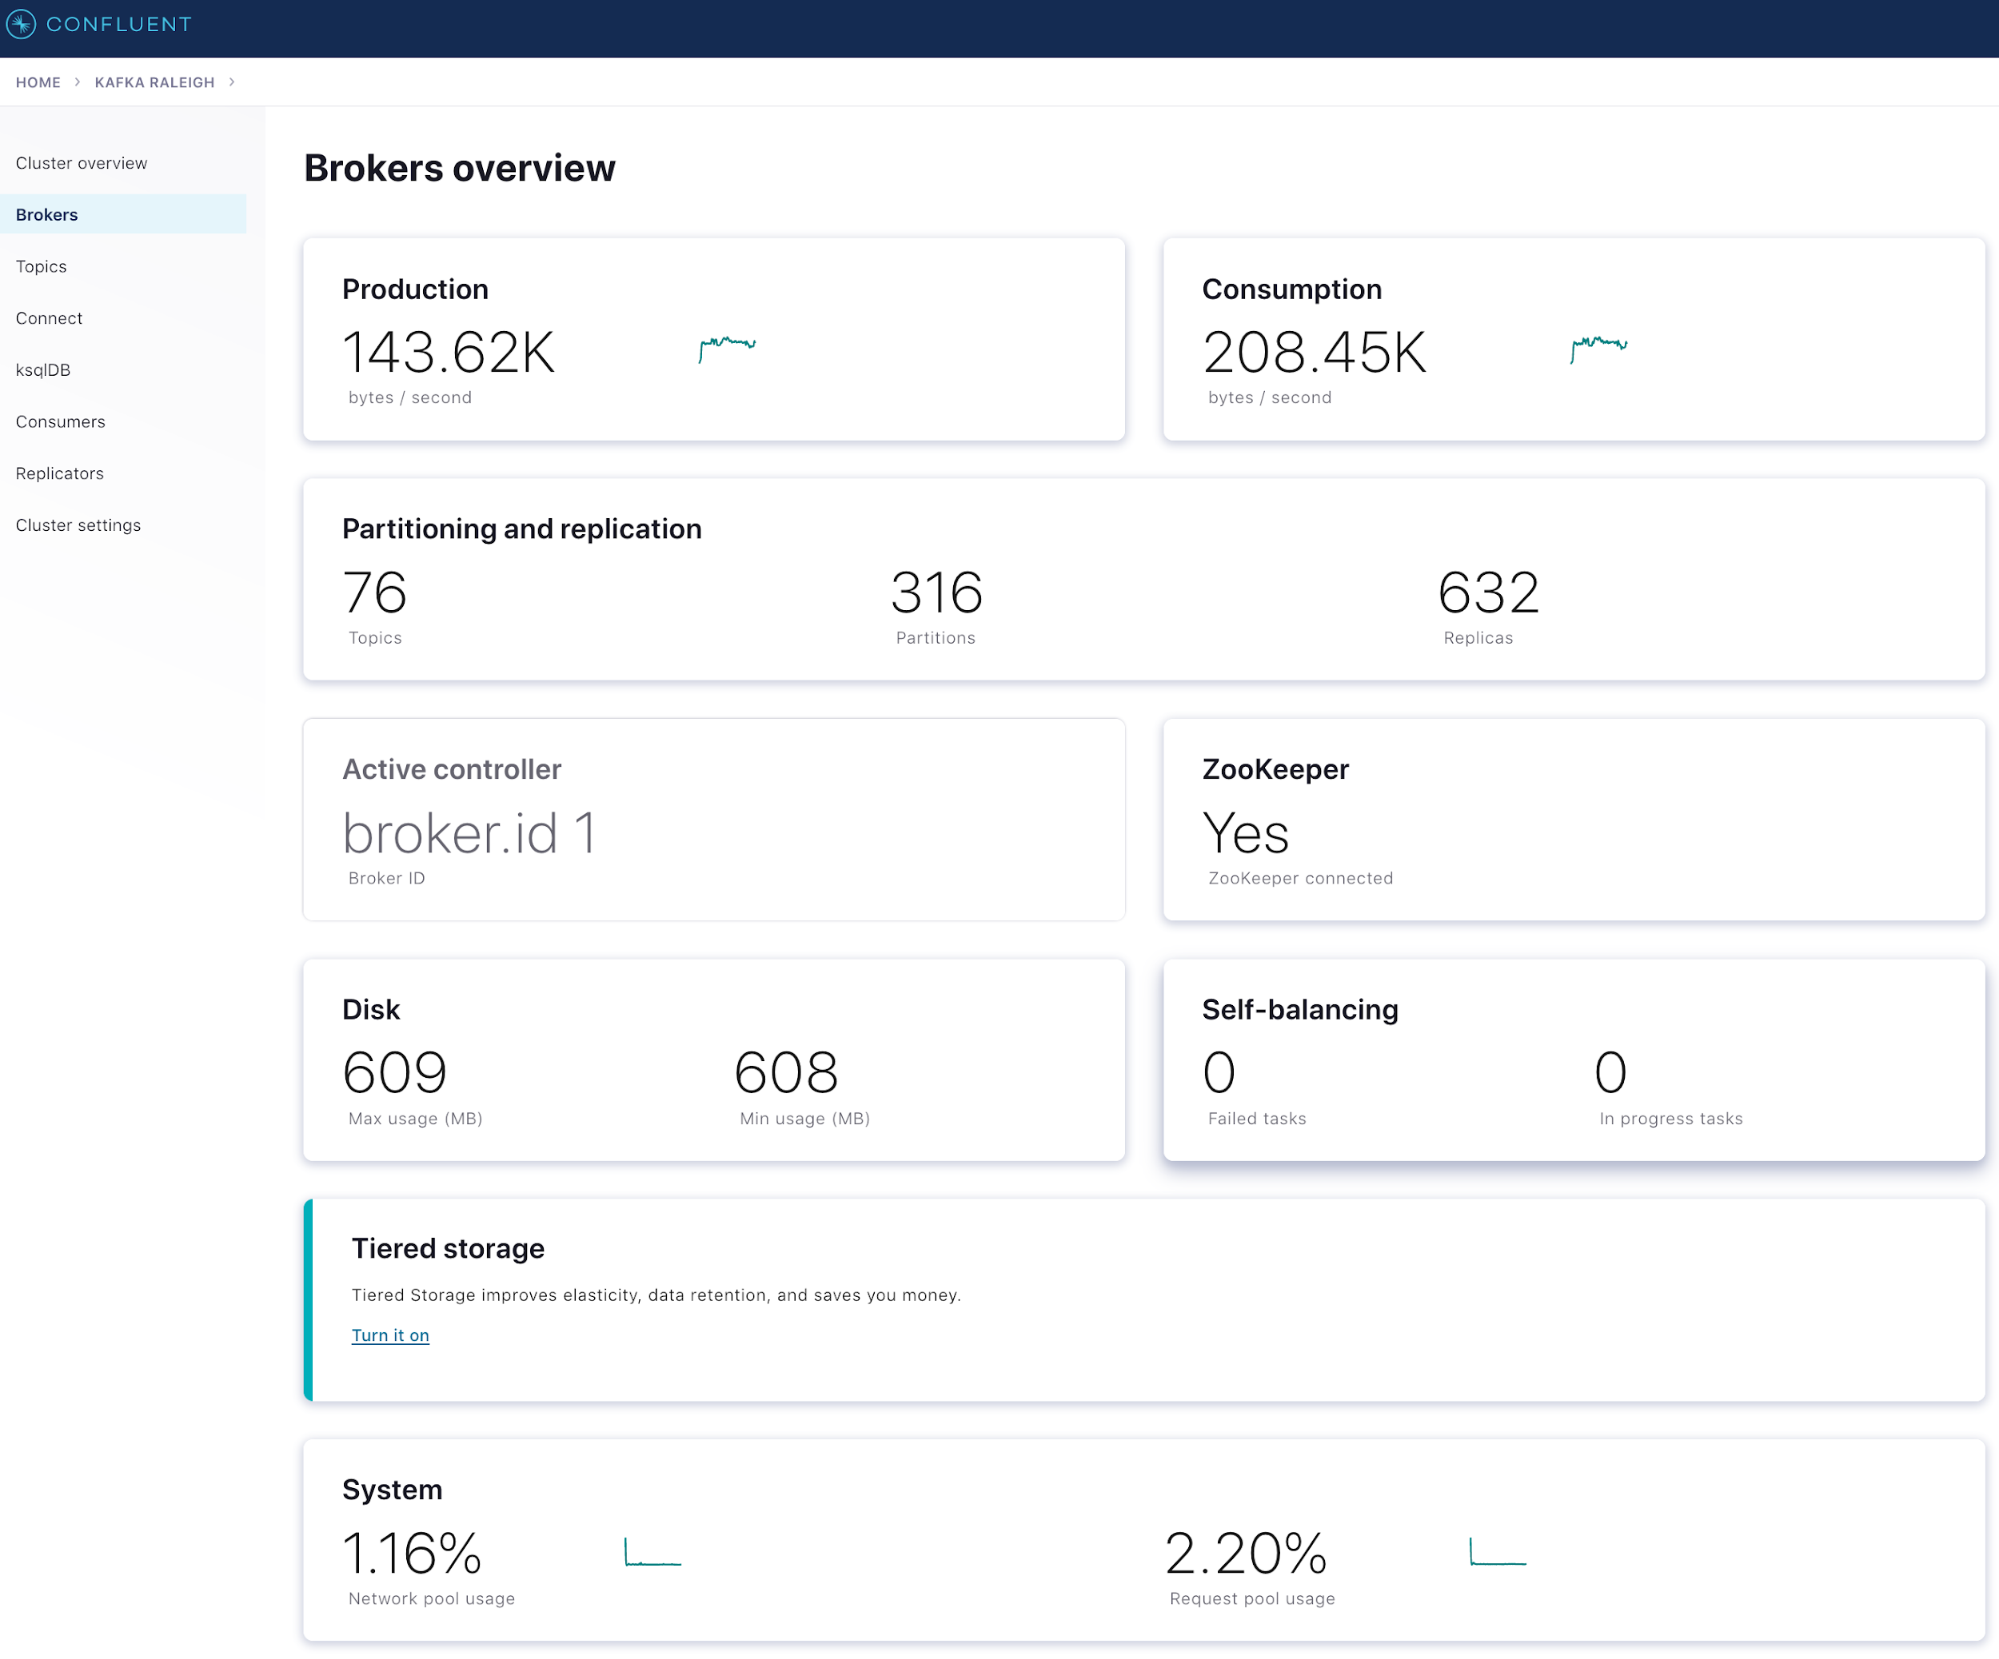
- The “Brokers” drill-down panel provides more details about how your brokers are performing and includes the most important broker-level metrics
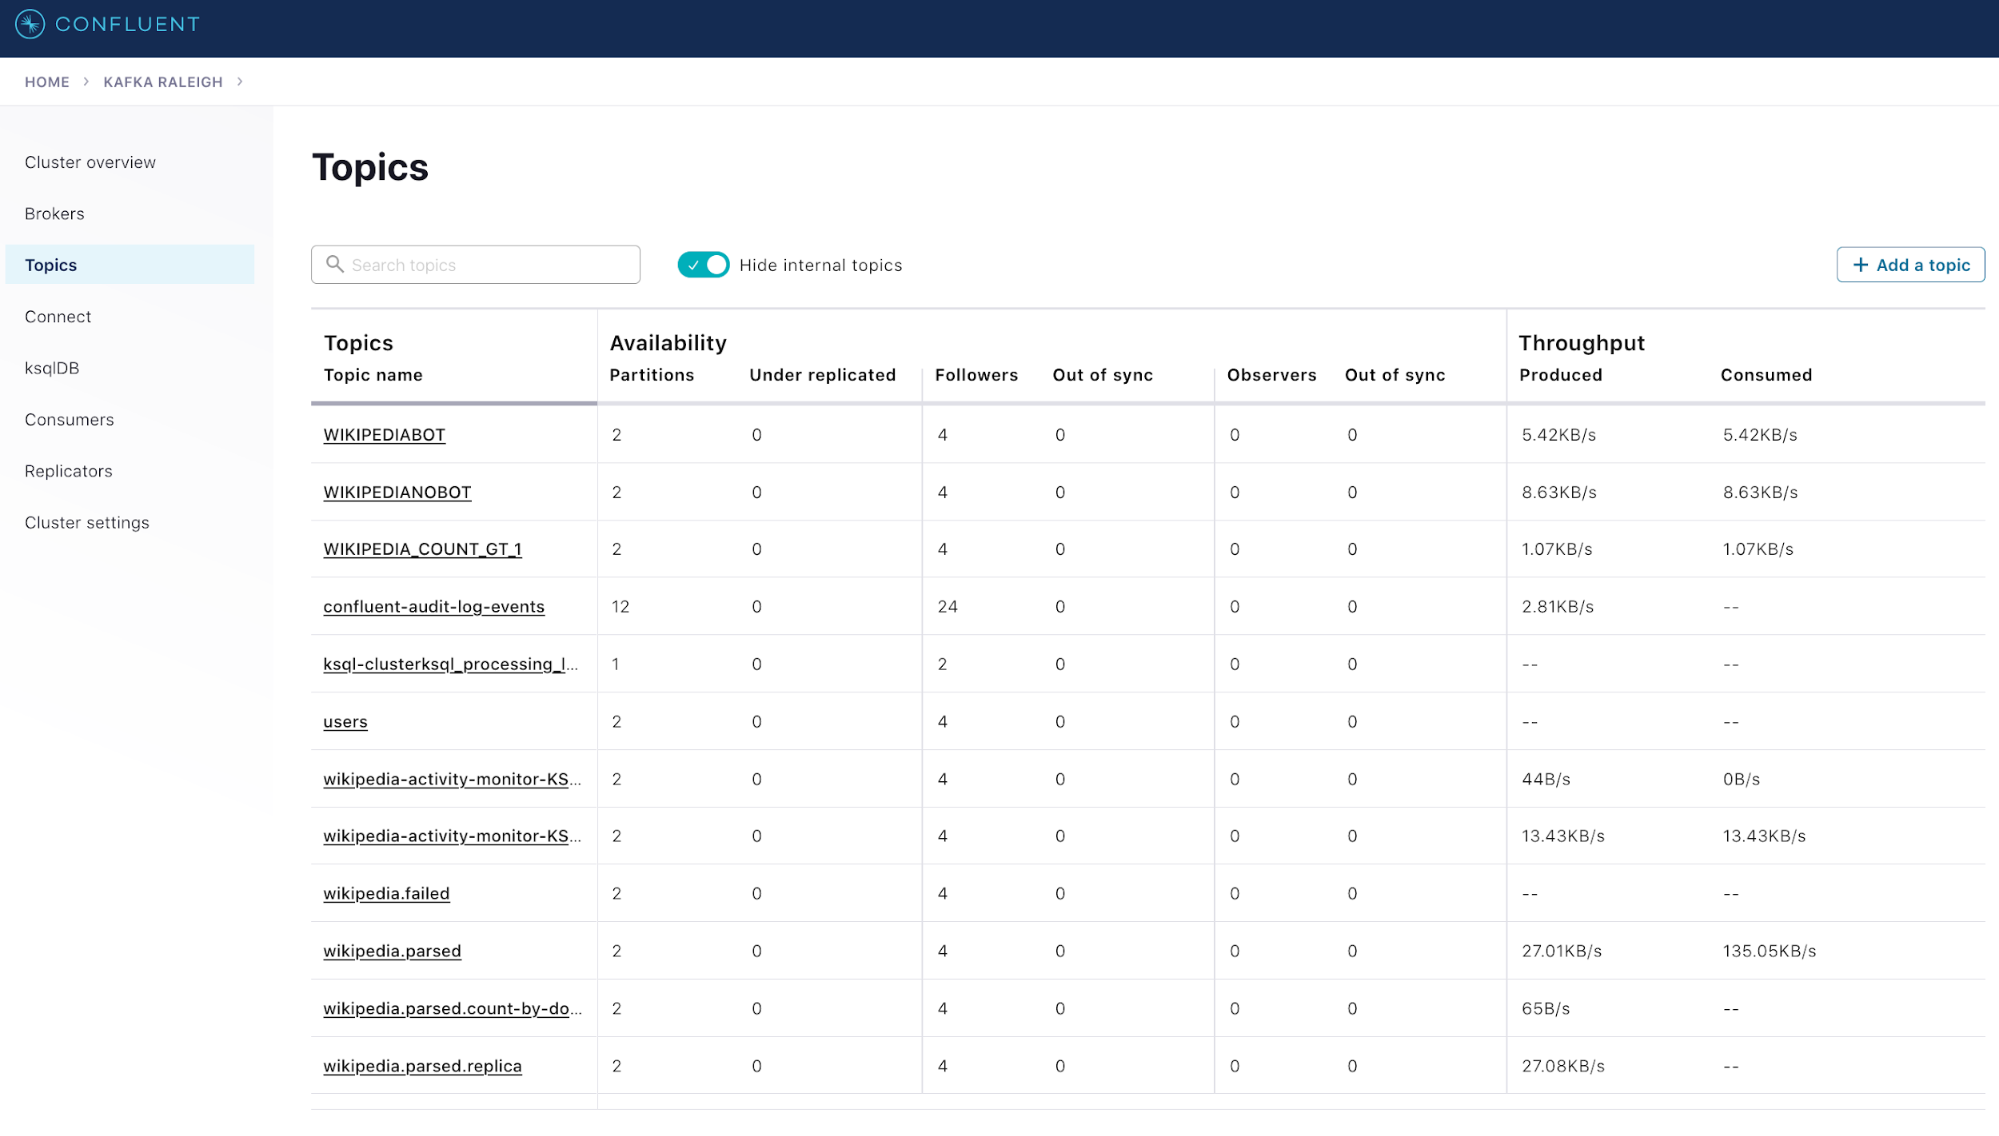
- The “Topics” view provides topic-level statistics and shows activity details at the topic level
Prometheus is a tool used for aggregating multiple platform metrics while scraping hundreds of endpoints. It is purpose-built for scrape and aggregation use cases. Internally, it contains a time-series data store that allows you to store and retrieve time-sliced data in an optimized fashion. It also uses the OpenMetrics format, a CNCF Sandbox project that recently reached v1.0 and is expected to gain traction, with many tools supporting or planning to support it. (The metric exporters created and leveraged by the Prometheus community already adhere to these standards.) Grafana is an open source charting and dashboarding tool that talks to Prometheus and renders beautiful graphs.
Code examples are available in the jmx-monitoring-stacks repository on GitHub and will get you from no dashboards in Prometheus and Grafana to something that looks like what we have below in a matter of a few steps. The code works closely with cp-demo as well. If you want to know how it works and what it does to get the intended result, you can spin up Confluent using Docker on your local machine and view these dashboards locally, without any additional setup.
If you want to set up your Confluent clusters with Prometheus-based monitoring, read along. Below is a preview of what we’ll end up with:
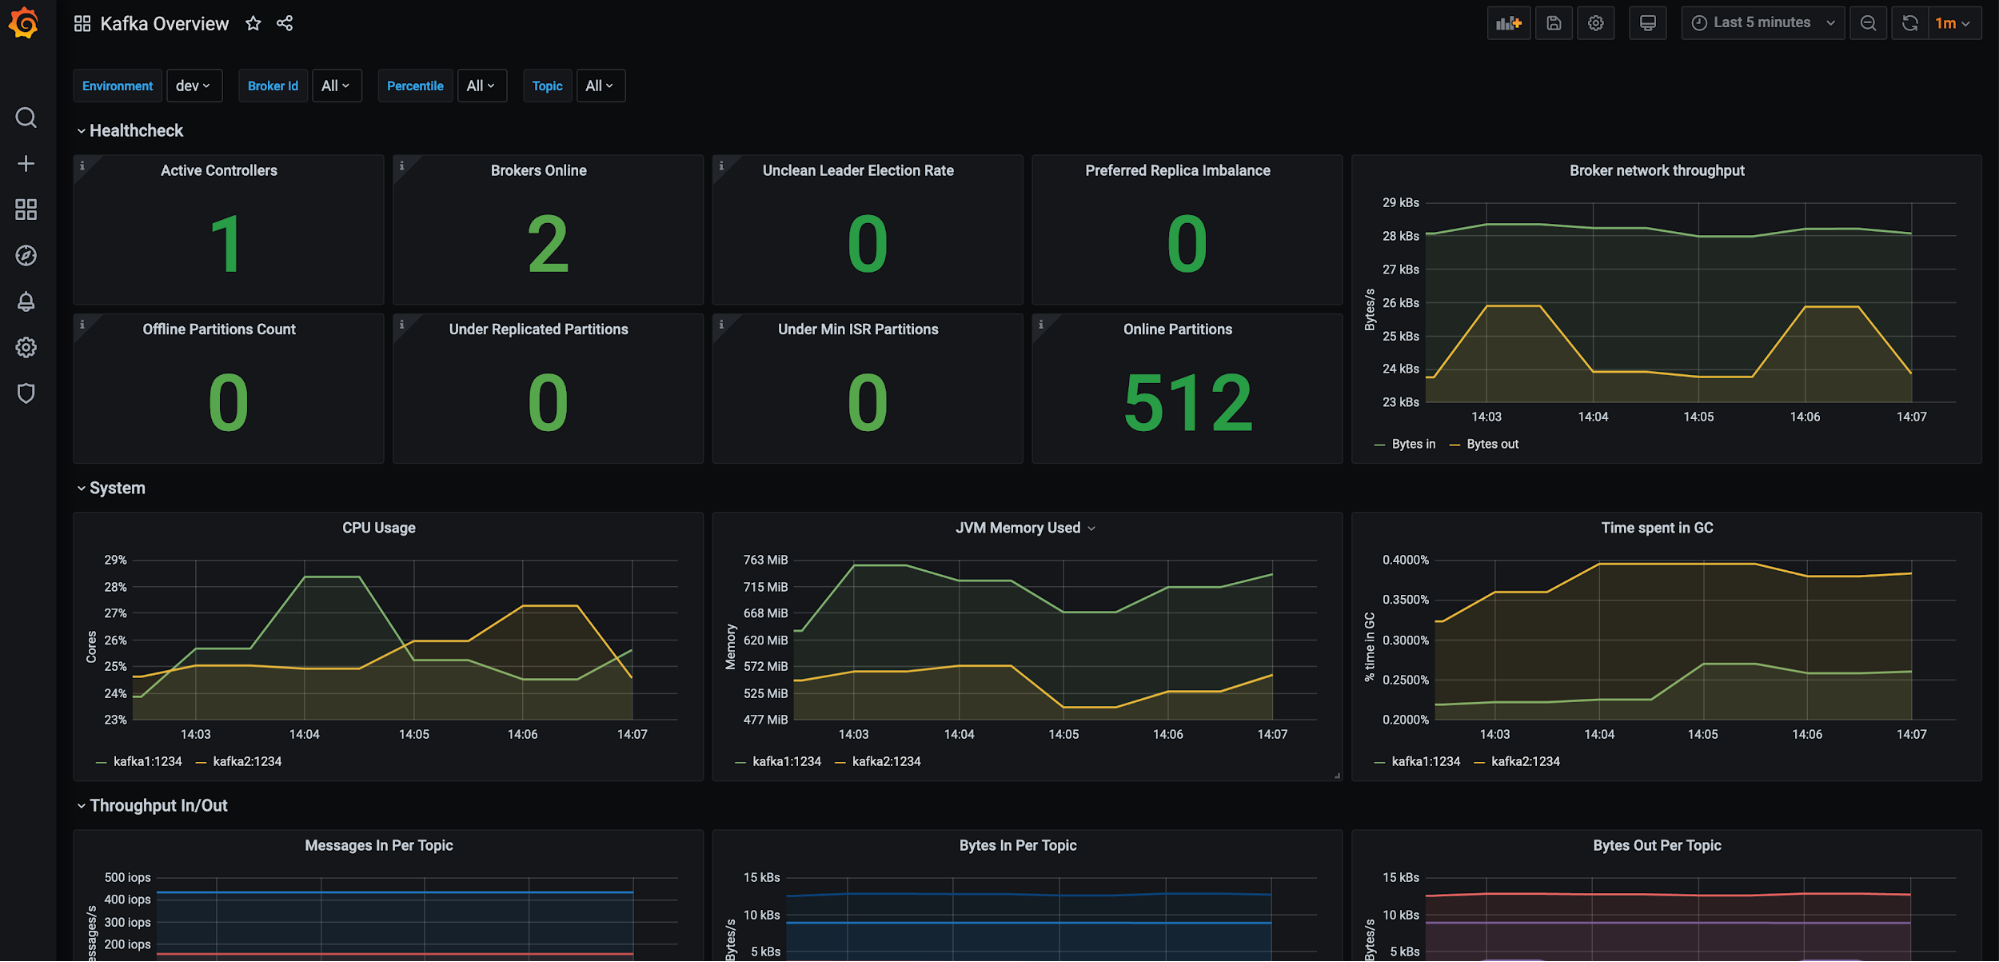
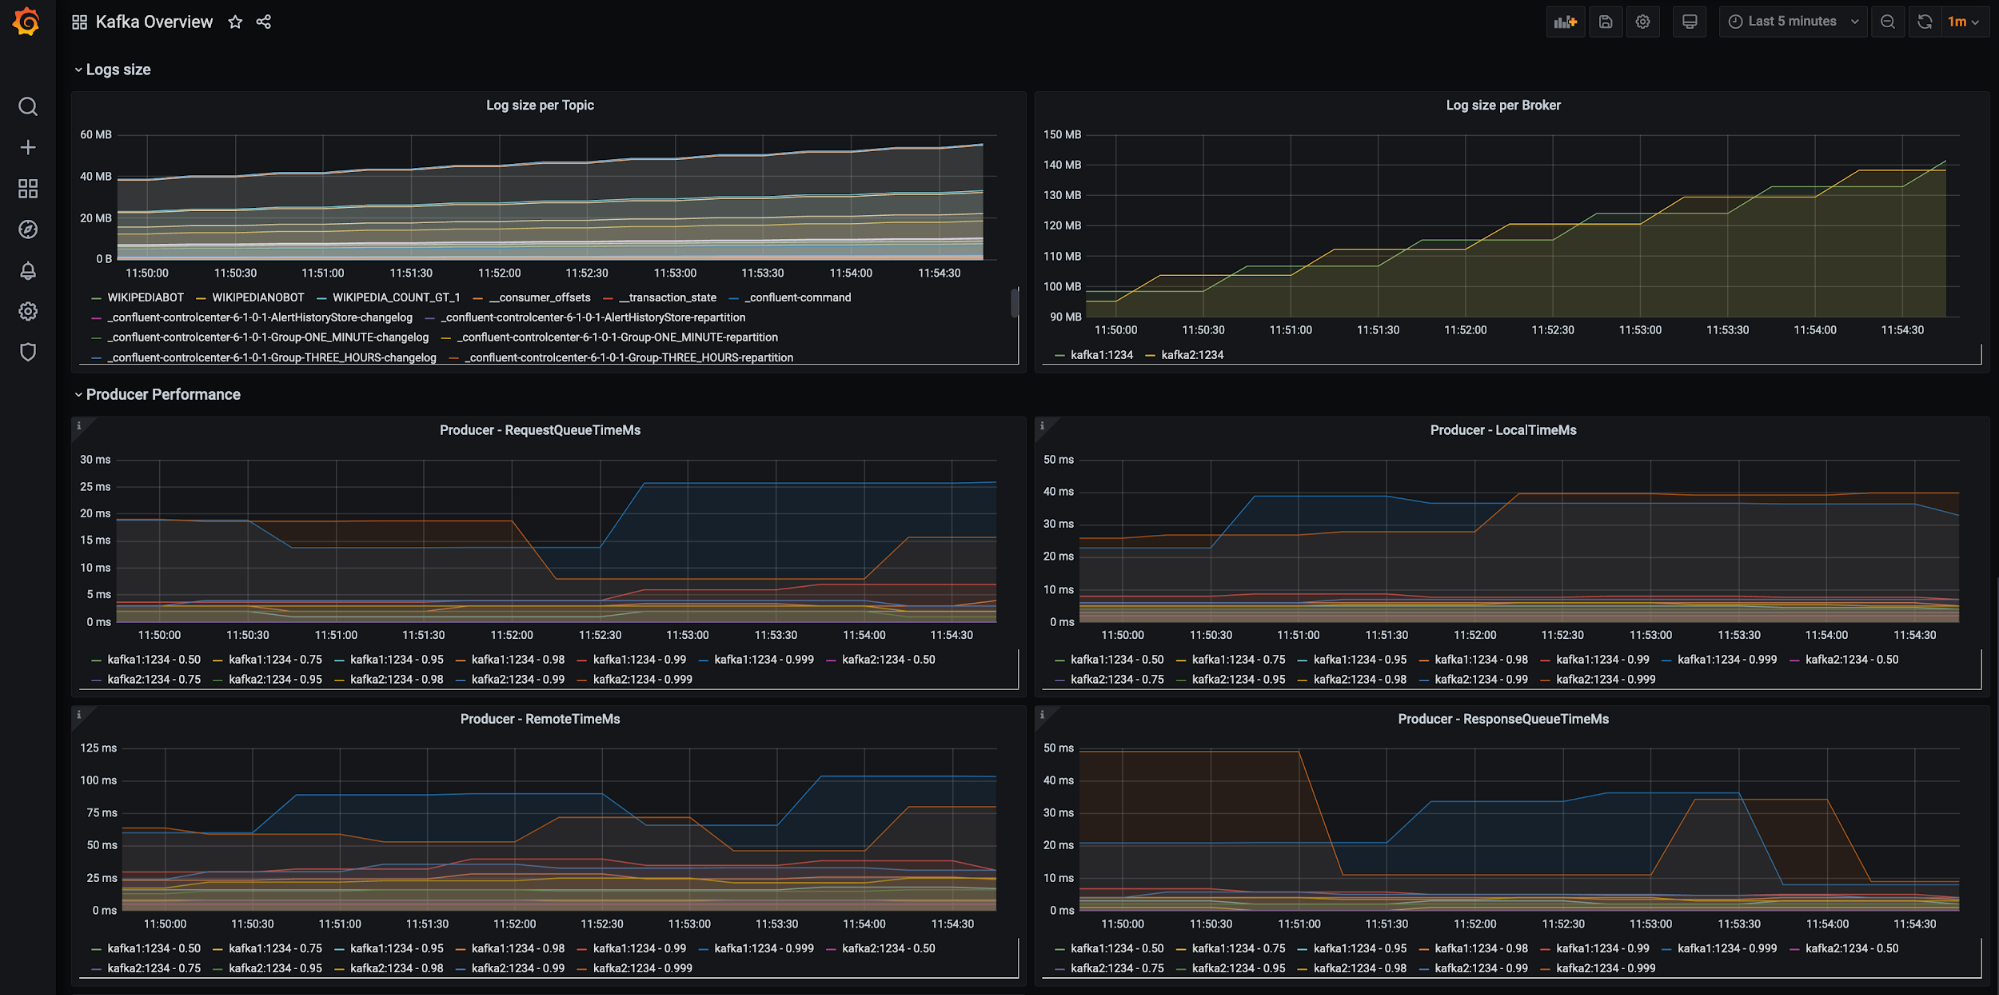
There are many more dashboards to see after we wire everything up, so without any further ado, let’s get started!
How does Prometheus work?
Prometheus is an ecosystem with two major components: the server-side component and the client-side configuration. The server-side component is responsible for storing all the metrics and scraping all clients as well. Prometheus differs from services like Elasticsearch and Splunk, which generally use an intermediate component responsible for scraping data from clients and shipping it to the servers. Because there is no intermediate component scraping Prometheus metrics, all poll-related configurations are present on the server itself.
The process looks like this: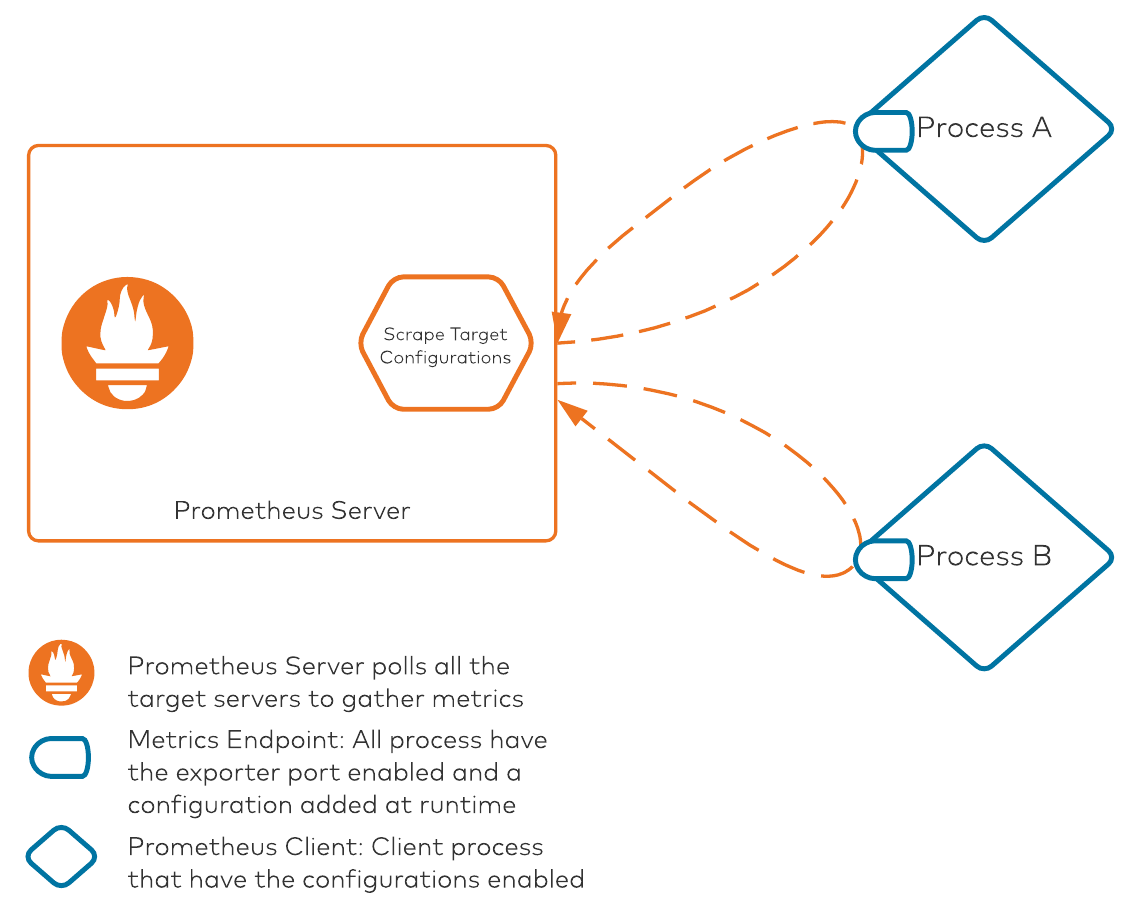
There are two core pieces in this diagram:
- Prometheus server: This component is responsible for polling all of the processes/clients with their metrics exposed on a specific port. The Prometheus server internally maintains a configuration file that lists all the server IP addresses/hostnames and ports on which Prometheus metrics are exposed. The scrape target configuration is the file that keeps all target mapping within Prometheus. Scrape targets are required when we are deploying everything manually without any automation. Prometheus also supports service discovery modules, which it can leverage to discover any available services that are exposing metrics. This auto-discovery is an amazing tool when used with Kubernetes-based deployments, where Pod names (among other elements) are ephemeral. To keep it simple, Prometheus service discovery won’t be covered in this post.
- Client processes: All clients that want to leverage Prometheus will need two configuration pieces. First, they must use the Prometheus client library to expose metrics in a Prometheus compatible format (OpenMetrics). Secondly, they must use a YAML configuration file for extracting JMX metrics. This configuration file is used for converting, renaming, and filtering some of the attributes for consumption. The YAML configuration file is necessary for the JVM client, as the JVM MBeans are exposed, converted, and/or renamed to a specific format for consumption using this configuration file.
Enabling Prometheus for Confluent
In the following examples, we will use the Docker-based Confluent Platform and run it on a laptop. All server addresses and ports are hosted on my local network and may not work for your testing. We will begin setting up specific pieces one by one and eventually configure Prometheus for the entire platform. Note that if you are using CP-Ansible to deploy Confluent components, you can skip this section, as this is already taken care of via playbook configurations. As you follow along, you can update the server addresses and ports according to your server configurations.
Configuration files for Confluent
To set up the Prometheus client exporter configuration for all Confluent components, we need the following:
- JMX exporter JAR file: This file is responsible for exposing all of the JVM metrics in a Prometheus-compatible format. The JAR file should be copied on all of the servers where Prometheus clients reside, and it will be activated using the Java agent switch on the command line for all components. Don’t worry about the exact syntax, as we will get to those pieces in just a few moments. For now, copy the JAR file (direct link to the file on Maven Repository) to all of the servers that will be used to run Confluent components.
- Exporter configuration files: We’ve been discussing the configuration files for a while. The complete details of the files are out of scope for this post, but to make the configurations easier, you can view the configuration files for all Confluent components on GitHub. If you want to understand how the JMX exporter configurations work, the source code repository is an excellent start—it is extensive and has good documentation about what the switches do and how to use them.
These configuration files are required on all servers and JVMs in order to read the MBeans for conversion into a Prometheus-compatible format. The configuration files rename some attribute names and/or append them to the primary Bean name, or use a particular field as the value for the exposed MBean. As an open source project, these configuration files receive contributions from many people, and you are welcome to make a pull request for any new feature that you would like the repository to have out of the box.
Setting up the metrics endpoint on the Kafka broker
We’ll use the Kafka broker as an example in this post and enable its Prometheus scrape. All of the other components will also follow the same pattern and will be scraped in the same way.
The configuration file that you downloaded may look like the following (note that this is not the complete file):
lowercaseOutputName: true
rules:
# Special cases and very specific rules
- pattern : kafka.server<type=(.+), name=(.+), clientId=(.+), topic=(.+), partition=(.*)><>Value
  name: kafka_server_$1_$2
  type: GAUGE
  labels:
    clientId: "$3"
    topic: "$4"
    partition: "$5"
- pattern : kafka.server<type=(.+), name=(.+), clientId=(.+), brokerHost=(.+), brokerPort=(.+)><>Value
  name: kafka_server_$1_$2
  type: GAUGE
  labels:
    clientId: "$3"
    broker: "$4:$5"

- pattern : kafka.server<type=KafkaRequestHandlerPool, name=RequestHandlerAvgIdlePercent><>OneMinuteRate
  name: kafka_server_kafkarequesthandlerpool_requesthandleravgidlepercent_total
  type: GAUGE
Without going into too much detail, the “rules” are the formatting conditions custom created for MBeans, exported by all components. Some metrics warrant a specific way to handle the formatting and may need to rename the bean, as the native names might get too long. Each pattern (one rule) in the above example checks a regex-style pattern match on the MBeans found in the JVM and exposes them as metrics for all of the matched and appropriately formatted MBeans.
Now let’s copy the Prometheus JAR file and the Kafka broker YAML configuration file to a known location on the Kafka broker server. It would be nice to use the same directory everywhere—something like /opt/prometheus. To download the required files from the server:
- Log in to the server using SSH.
- Create the /opt/prometheus directory:
mkdir /opt/prometheus
- Allow access to the directory:
chmod +rx /opt/prometheus
- Change to the directory:
cd /opt/prometheus
- Download the configuration file first. You can copy these files from your local system as well, but for now we’ll keep it simple. Also note that the file names will change depending on the component name; all of the file names are listed in the jmx-monitoring-stacks repository. Pick the right one for the service that you are configuring. Visit the link below and manually download the file:
https://github.com/confluentinc/jmx-monitoring-stacks/blob/6.1.0-post/shared-assets/jmx-exporter/kafka_broker.yml
- Download the JAR file as well:
wget https://repo1.maven.org/maven2/io/prometheus/jmx/jmx_prometheus_javaagent/0.15.0/jmx_prometheus_javaagent-0.15.0.jar
Now that we have both of the necessary files, let’s move to the next step of adding them to the startup command. The startup command varies by installation type. If the Confluent packages were installed using yum/apt, the startup arguments will need modifications. Other processes will follow a similar approach as well. The following line needs to be injected into the startup command for the Kafka broker. You can inject it by appending the KAFKA_OPTS variable or by adding an EXTRA_ARGS variable with the following (both of these can be done using the override.conf file):
-javaagent:/opt/prometheus/jmx_prometheus_javaagent-0.15.0.jar=1234:/opt/prometheus/kafka_broker.yml
- The JAR file location: /opt/prometheus/jmx_prometheus_javaagent-0.15.0.jar; this location will change if you have not used /opt/prometheus as your JAR file’s download location.
- The port number used for my configuration, 1234, is the same port used for all of the Docker pods in the jmx-monitoring-stacks repository as well. The default port used by JMX exporters is 9404 (if you do not add them explicitly). This port can be any port number that is available on the server. Make sure not to use the same port as the Kafka broker listener ports, otherwise the Kafka broker or JMX exporter may not start up properly.
- The configuration file location, /opt/prometheus/kafka_broker.yml; this location will change if you have not used /opt/prometheus as your configuration file’s download location.
- Restart your Kafka broker. On a CP-Ansible based install on a Linux machine, the default install is done using the package management tools. Restart commands are available with systemd. An appropriate command will look something like this:
sudo systemctl restart confluent-server.service
- After the restart, the line that we tried to inject should show up in the process command. To check the details, type this:
ps -ef | grep kafka.Kafka | grep javaagent
The output should resemble the following:
java -Xmx1G -Xms1G -server -XX:+UseG1GC -XX:MaxGCPauseMillis=20 -XX:InitiatingHeapOccupancyPercent=35 -XX:+ExplicitGCInvokesConcurrent -XX:MaxInlineLevel=15 -Dkafka.logs.dir=/var/log/kafka -Dlog4j.configuration=file:/etc/kafka/log4j.properties -cp /usr/bin/../<lots of classpath data>..... -javaagent:/opt/prometheus/jmx_prometheus_javaagent-0.15.0.jar=1234:/opt/prometheus/kafka_broker.yml kafka.Kafka /etc/kafka/kafka.properties
- To validate that the endpoint is correctly set up, go to your web browser and type the following, replacing <kafkabrokerhostname> with your Kafka broker hostname:
http://<kafkabrokerhostname>:1234/metrics
The full text of all of the metrics should be displayed on your browser screen. If that doesn’t show up, there is something wrong with your configuration. The text should be similar to this:
# TYPE jmx_exporter_build_info gauge
jmx_exporter_build_info{version="0.15.0",name="jmx_prometheus_javaagent",} 1.0
# HELP jmx_config_reload_success_total Number of times configuration have successfully been reloaded.
# TYPE jmx_config_reload_success_total counter
jmx_config_reload_success_total 0.0
# HELP kafka_coordinator_transaction_transactionmarkerchannelmanager_unknowndestinationqueuesize Attribute exposed for management (kafka.coordinator.transaction<type=TransactionMarkerC hannelManager, name=UnknownDestinationQueueSize><>Value)
.
.
A lot more data, hopefully :)
.
You should now be able to see the data in your web browser. We’ve performed a manual metrics scrape, although we just read it and did not store it anywhere. We’ll now follow the same process to configure metrics endpoints for the other services using their specific configuration files. Then we’ll move on to the next step: configuring Prometheus to scrape the endpoints.
Setting up scrape configurations in Prometheus
Now that we have taken care of the first two critical pieces that will help expose the Confluent components’ metrics, it’s time to tell the Prometheus server to scrape those new endpoints for metrics. Once the scrape is complete, Prometheus stores the metrics in a time series database. Fortunately, the Prometheus server manages all of that, but it is good to know where our data ends up. After all, we will eventually need to think about the storage requirements for our Prometheus server.
To configure the Prometheus server to scrape the Kafka broker:
- Log in to the Prometheus server using SSH.
- Run the following command to see where Prometheus is reading the configuration file:
ps -ef | grep prometheus
This command should give you something similar to the following output (don’t worry if it’s a bit different). All we need is the value from the --config.file switch:
/bin/prometheus --config.file=/etc/prometheus/prometheus.yml --storage.tsdb.path=/prometheus --web.console.libraries=/usr/share/prometheus/console_libraries --web.console.templates=/usr/share/prometheus/consoles
The Prometheus configuration file’s location in the above output is /etc/prometheus/prometheus.yml, but it could be different for you.
- Edit the configuration file and add a new “job” for the Prometheus server to poll. Make sure that you understand the semantics of the YAML configuration file. Indentation is important here. Add the following lines under the scrape_configs tag:
  - job_name: "kafka"
    static_configs:
      - targets:
          - "kafka1:1234"
          - "kafka2:1234"
        labels:
           env: "dev"
Note that the targets have two servers that we added for the Kafka broker job. This is the same port (1234) that we discussed while we were configuring the JMX exporters. Use the relevant port, if you customized it. We have also added an environment label, as we would want to mark these as part of the dev environment. For other environments, you would add a new job with the respective server targets and an env label marked as “test” or whatever the environment represents. These labels are critical, as the dashboards in the jmx-monitoring-stacks repository use these labels heavily to segregate the environments.
A sample scrape_config file for all Confluent components is available in GitHub as well. The file contains all of the labels that you need for every component and gives you a head start on configuration.
Now that all of the scrape configurations are set up, let’s save the file and restart Prometheus. After the restart, you can go to your browser window and open the following Prometheus server URL:
http://<prometheusServerHostname>:<prometheusport>/targets
Congratulations! You have successfully configured the auto scrape for your Confluent components from the Prometheus server. It should look something like this:
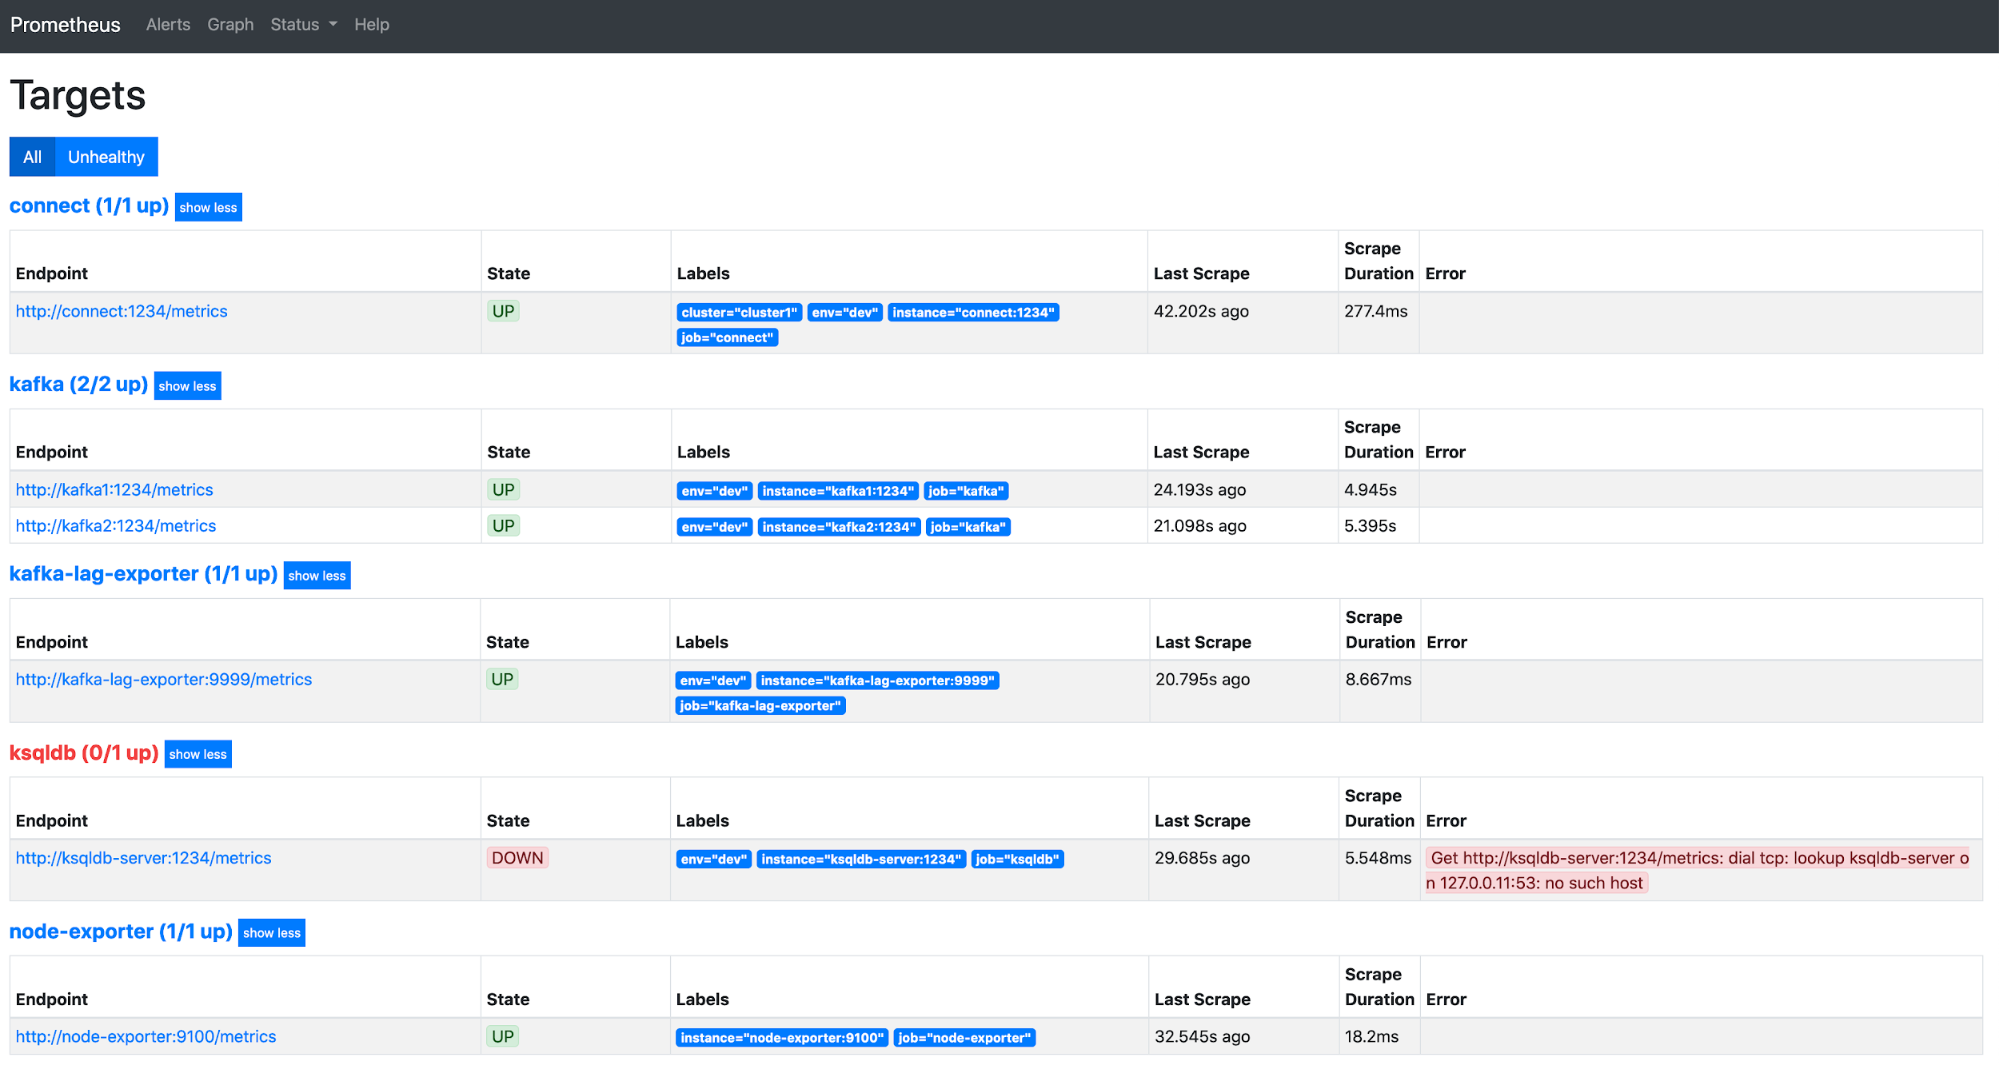
Note that a wrong configuration for the ksqlDB server scrape setup is included above, so it is displayed in red to signify that Prometheus server cannot reach the ksqlDB server. If all of your components are shown as healthy, you’re done with the Prometheus configuration. If not, ensure that the port numbers for all of the services are correct, the scrape configs are appropriately formatted, and your Confluent Server metrics port isn’t blocked due to any firewall restrictions.
Connecting Grafana to Prometheus
Now that we have our metrics data streaming into the Prometheus server, we can start dashboarding our metrics. The tool of choice in our stack is Grafana. Conceptually, here’s how the process will look once we have connected Grafana to Prometheus: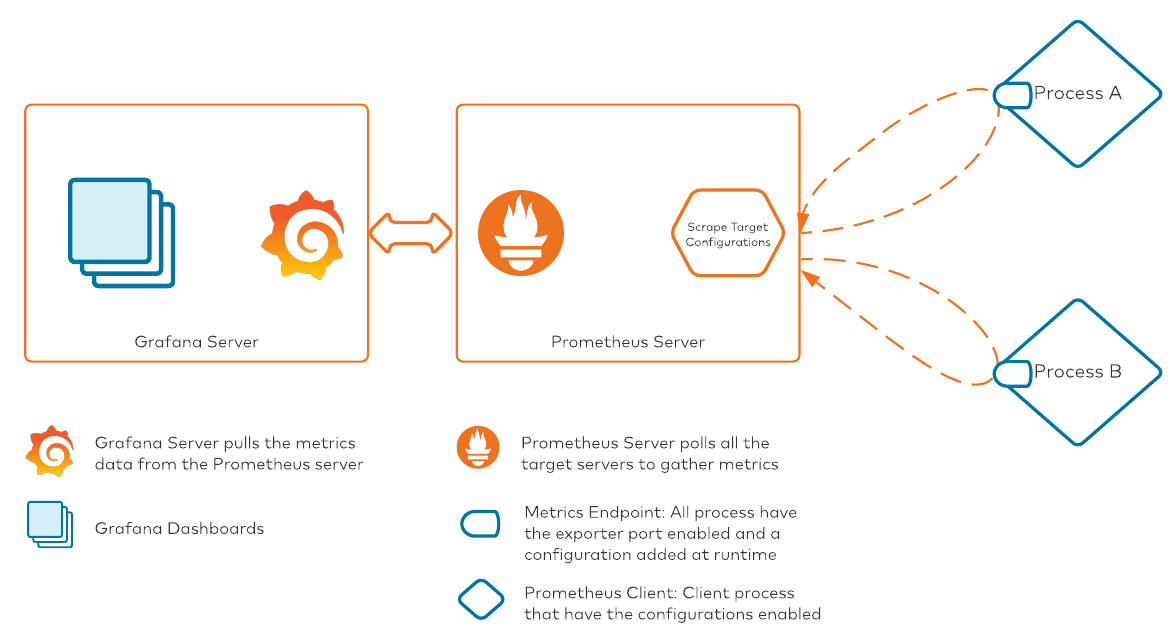
There are two ways to wire up Grafana with Prometheus: We can set up the connection from the Grafana GUI, or we can add the connection details to the Grafana configurations before startup. There are very detailed articles available in the Grafana documentation for both methods; in this post, we’ll set it up using the GUI.
- Log in to your Grafana instance from the web browser.

- Navigate to Configuration > Data Sources.
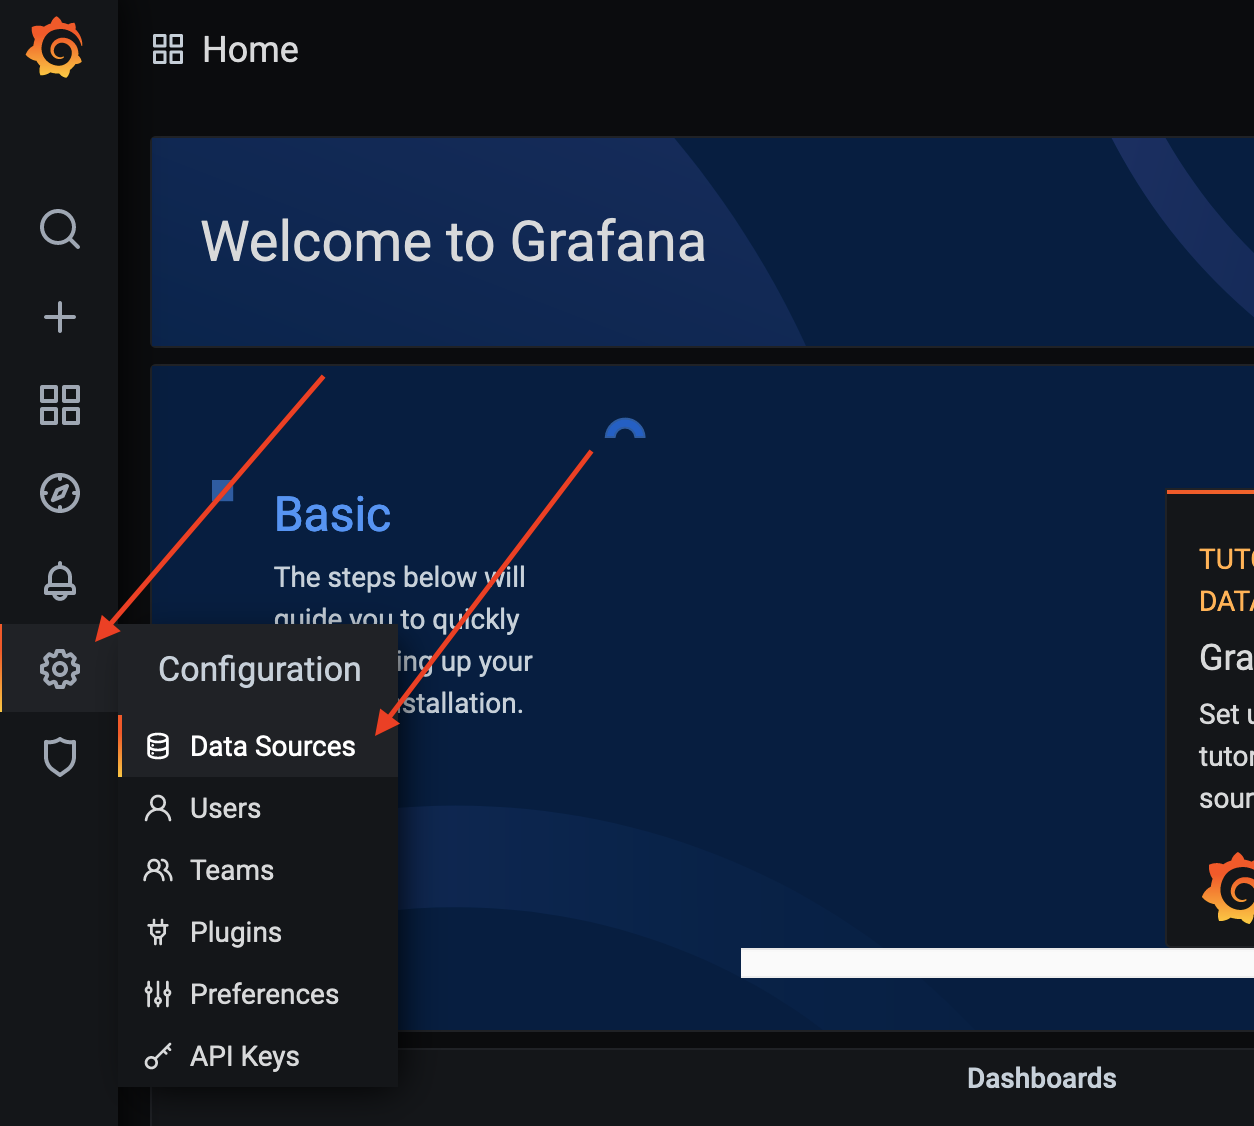
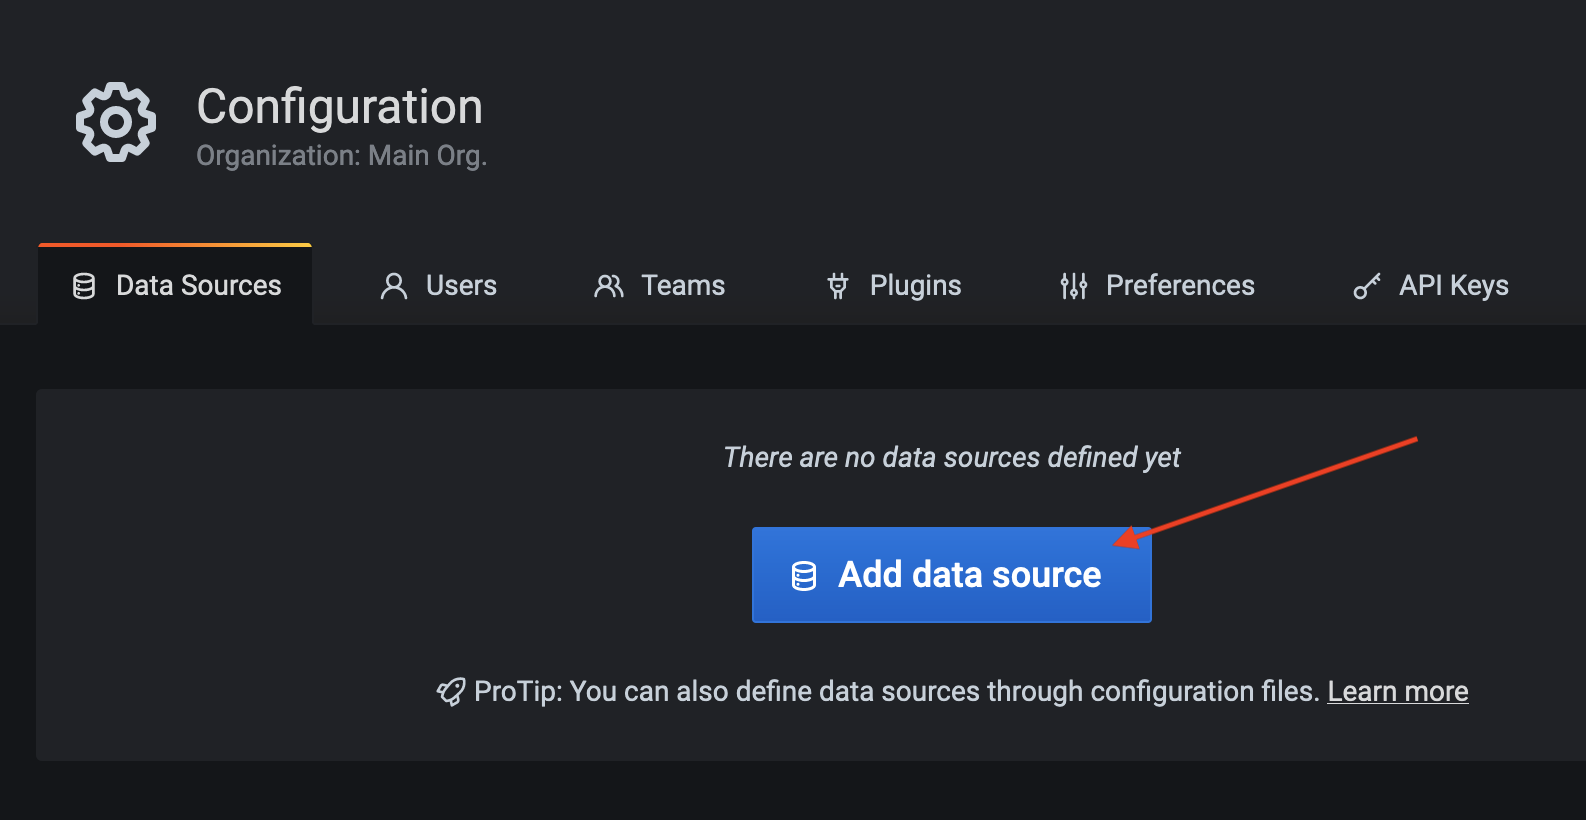
- Click Add data source.
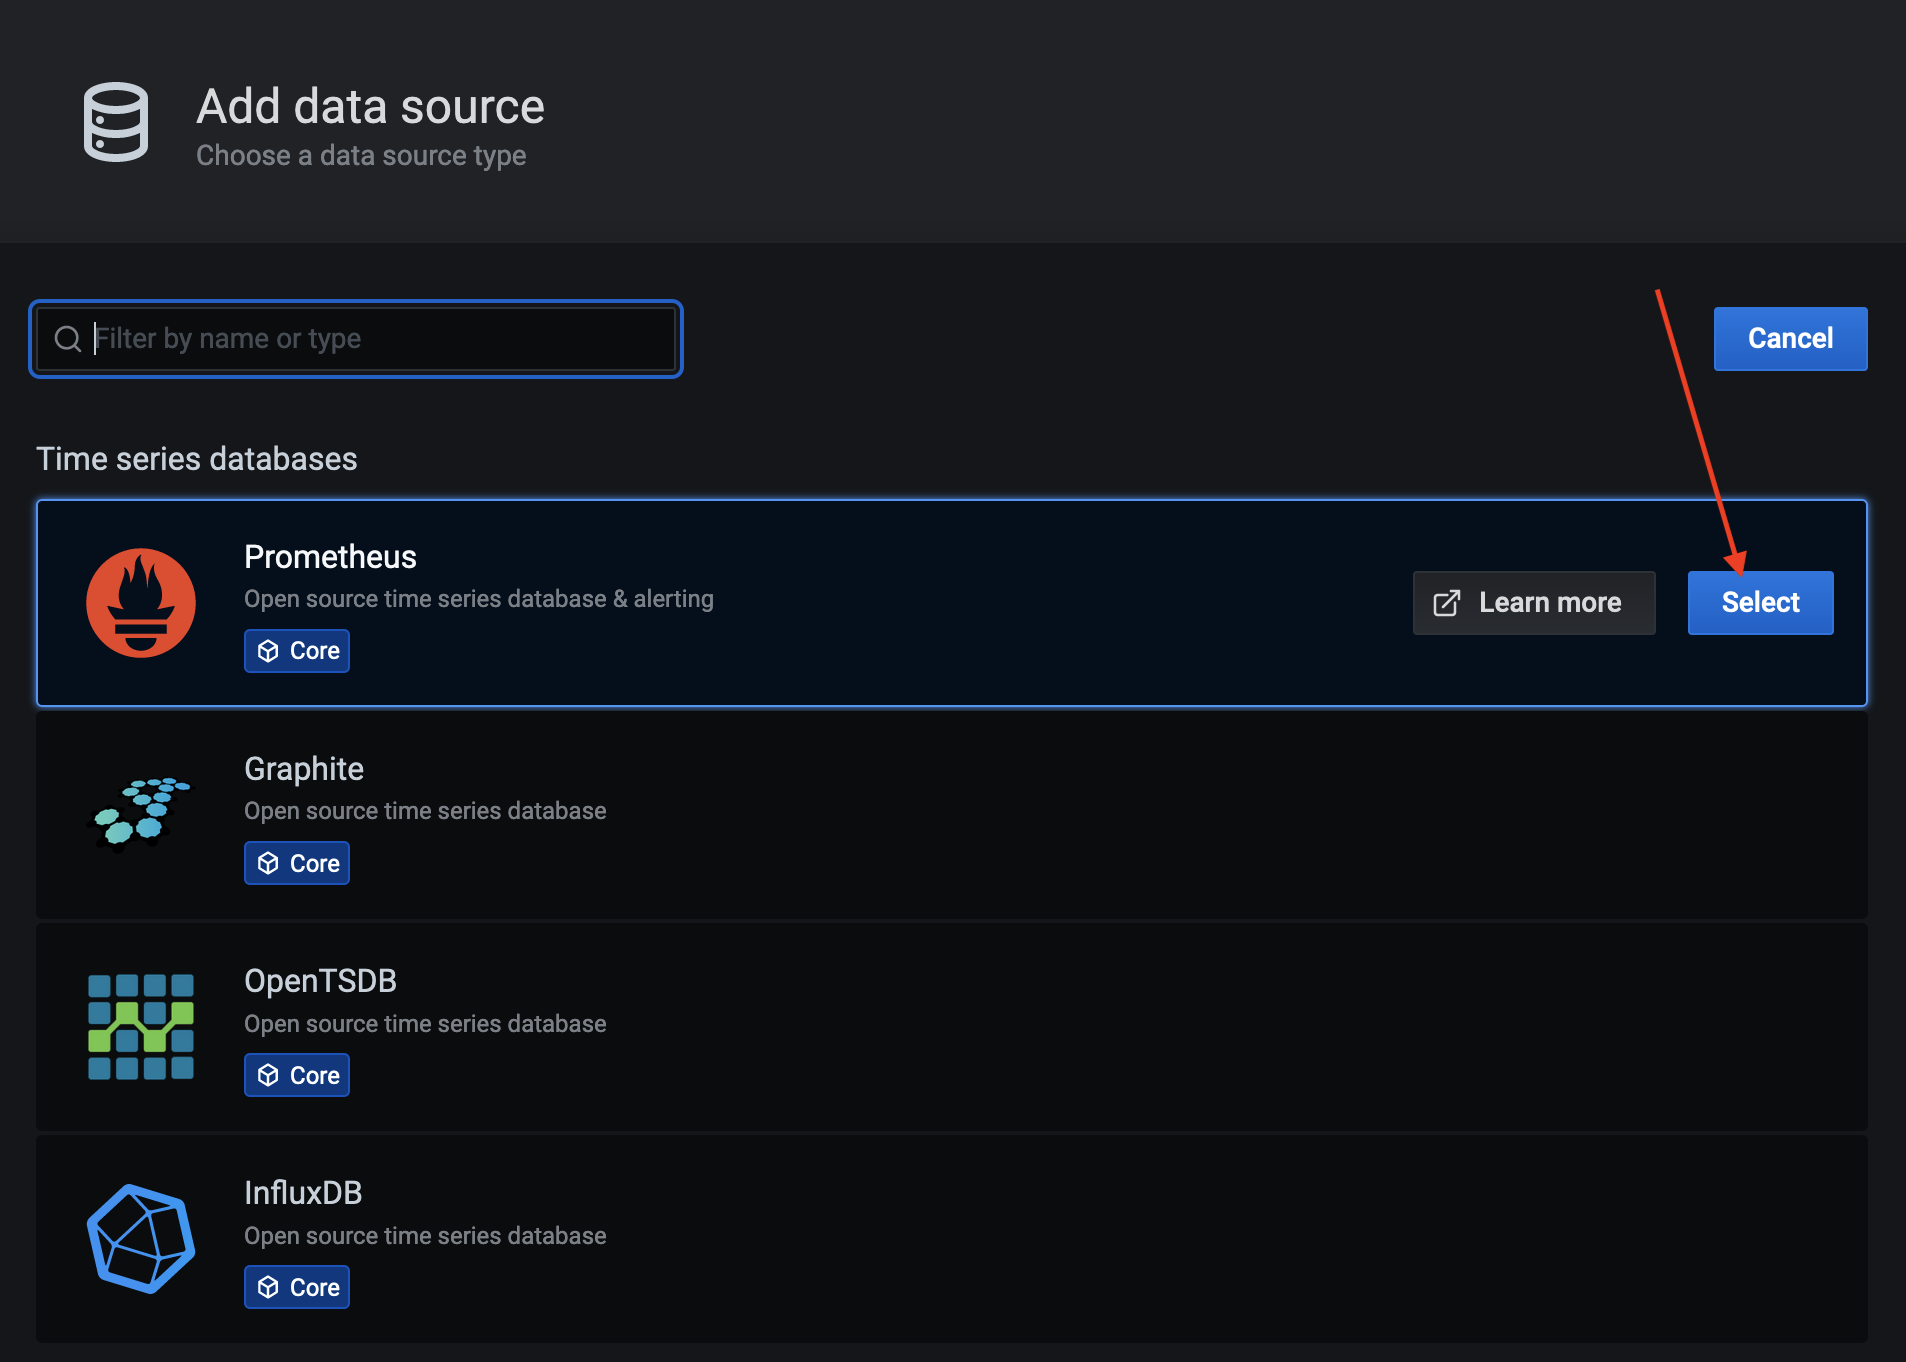
- You’ll see a number of options here. Prometheus should be close to the top. Hover over it and click Select.
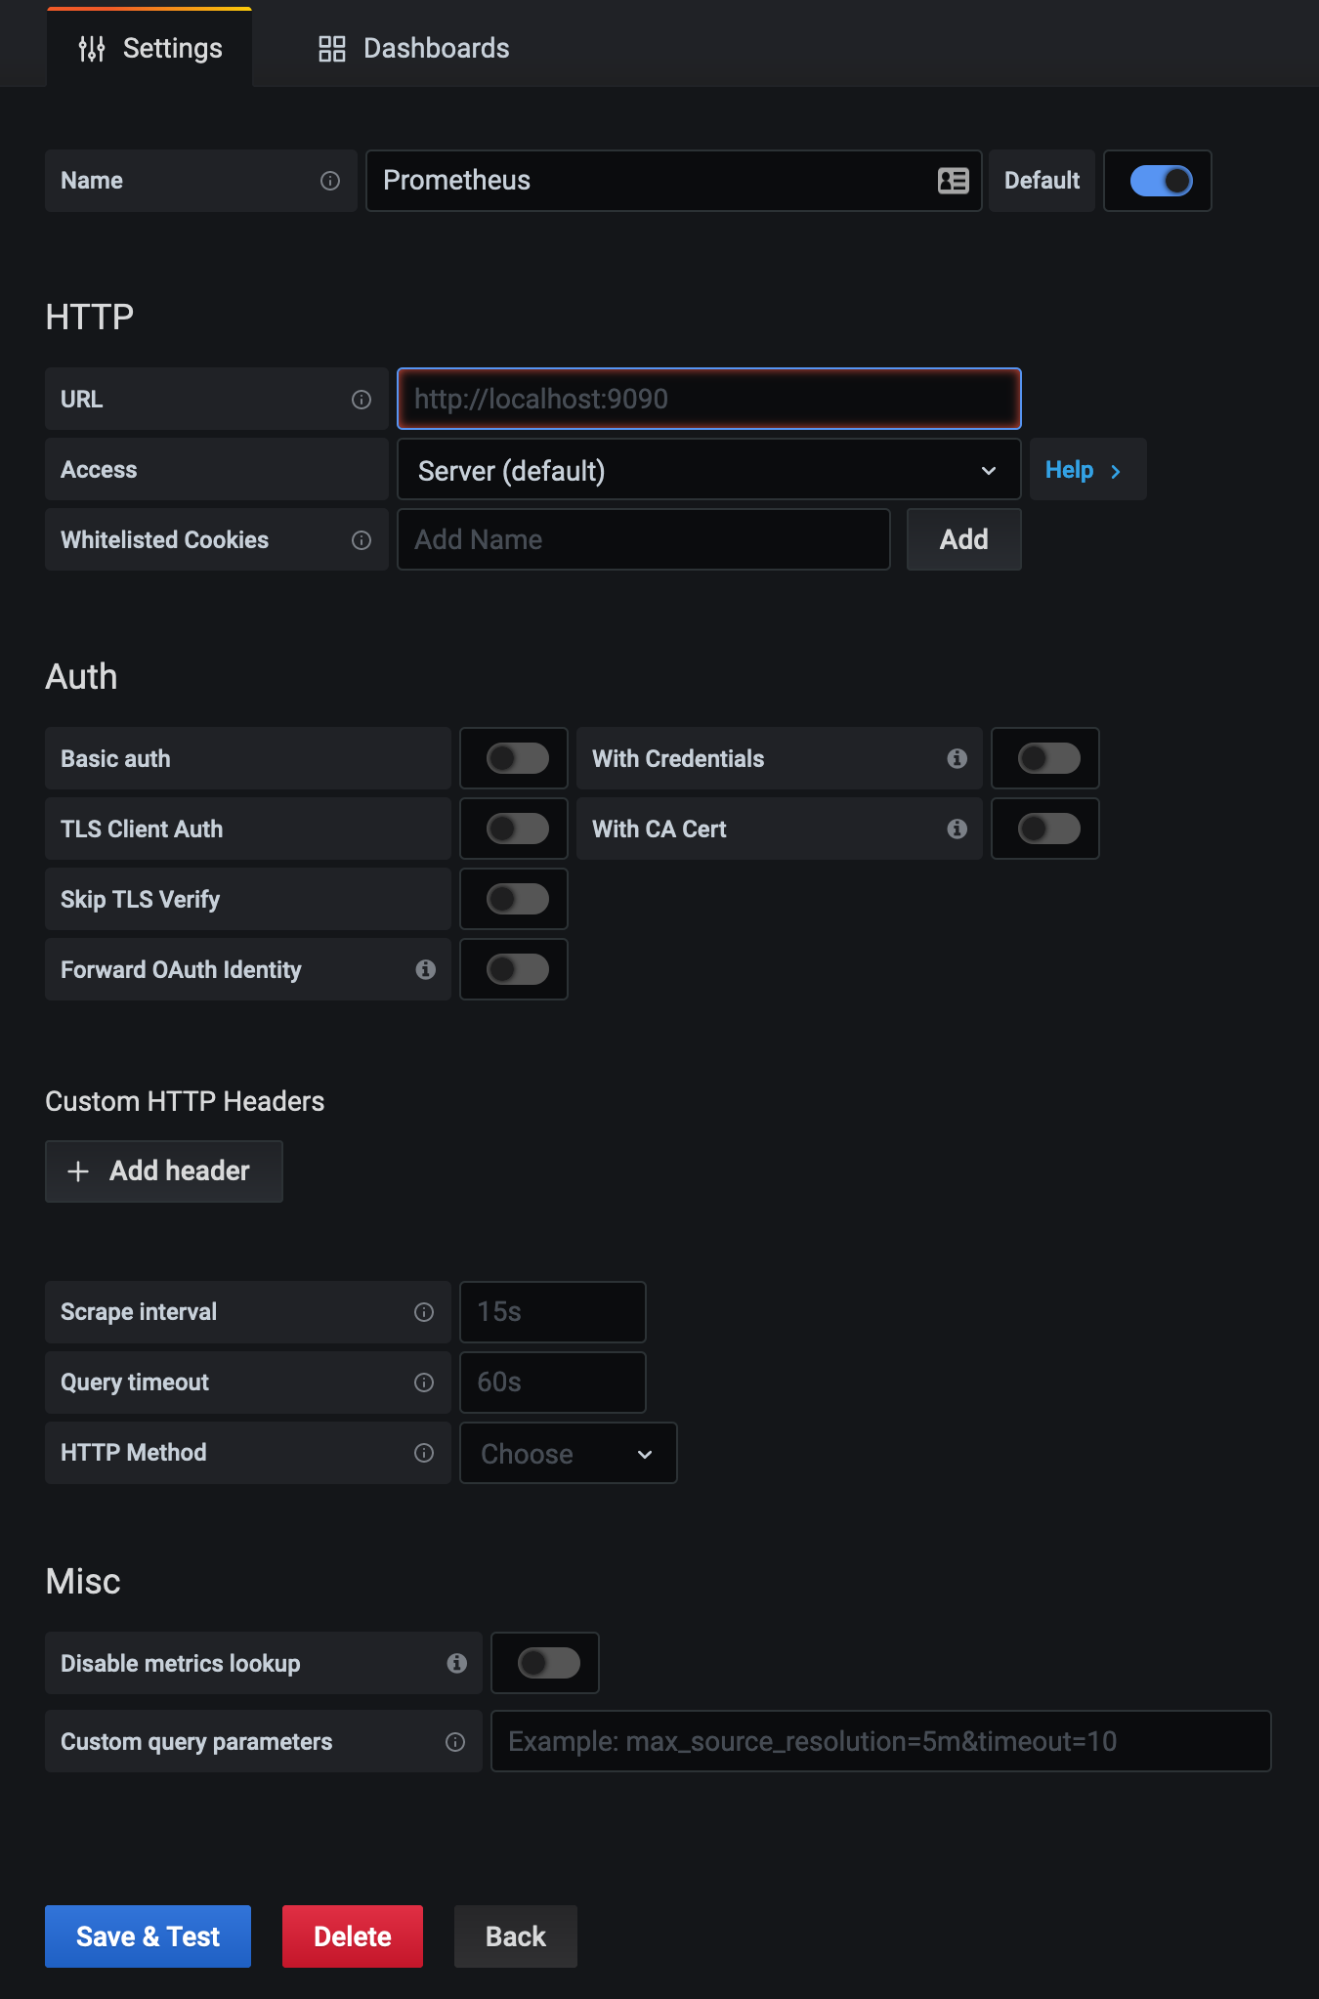
- Fill out all the details for your Prometheus server in the form that appears. Then click Save & Test.
- Once you click Save & Test, you should see a green message bar similar to the one below. If you get an error message, resolve that first before moving on to next steps.

- You can now close the page, as you have successfully set up Grafana communication with Prometheus as a data source.
Setting up Grafana dashboards
After setting up the Grafana link to Prometheus, we can now move on to the best part of this process: adding beautiful dashboards for our Confluent components. Let’s get to it!
- Import the dashboards into Grafana using JSON files. Download all of the dashboards in the jmx-monitoring-stacks repository and save them to a known location in your local system.
- Log in to your Grafana instance from the web browser.
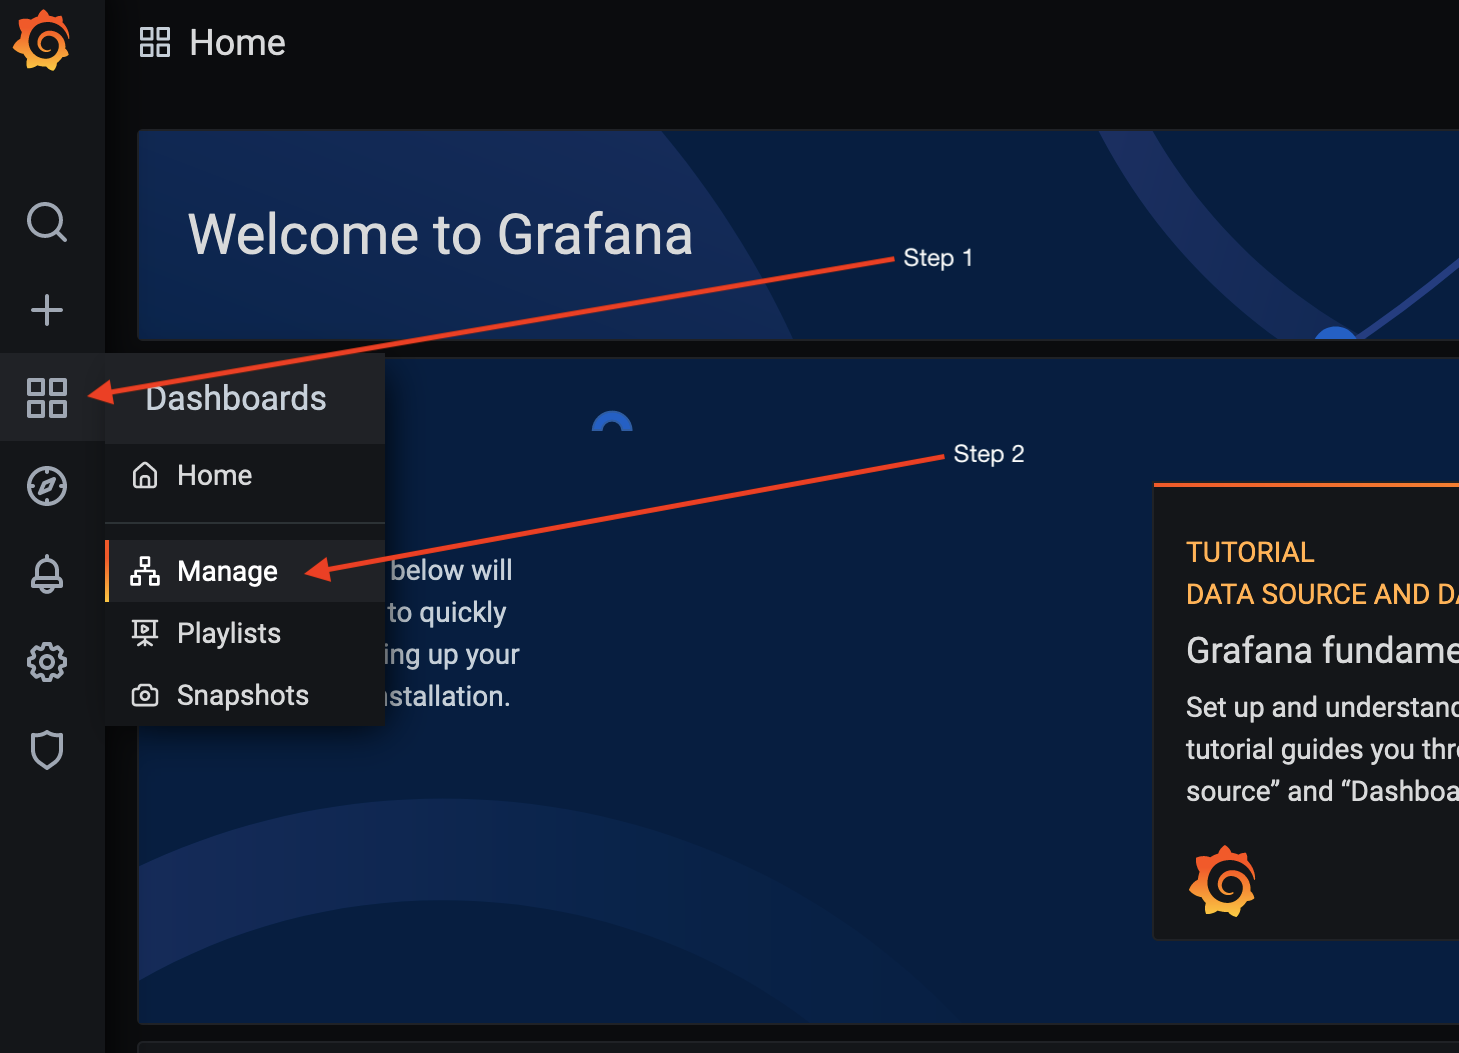
- Navigate to Dashboards > Manage.
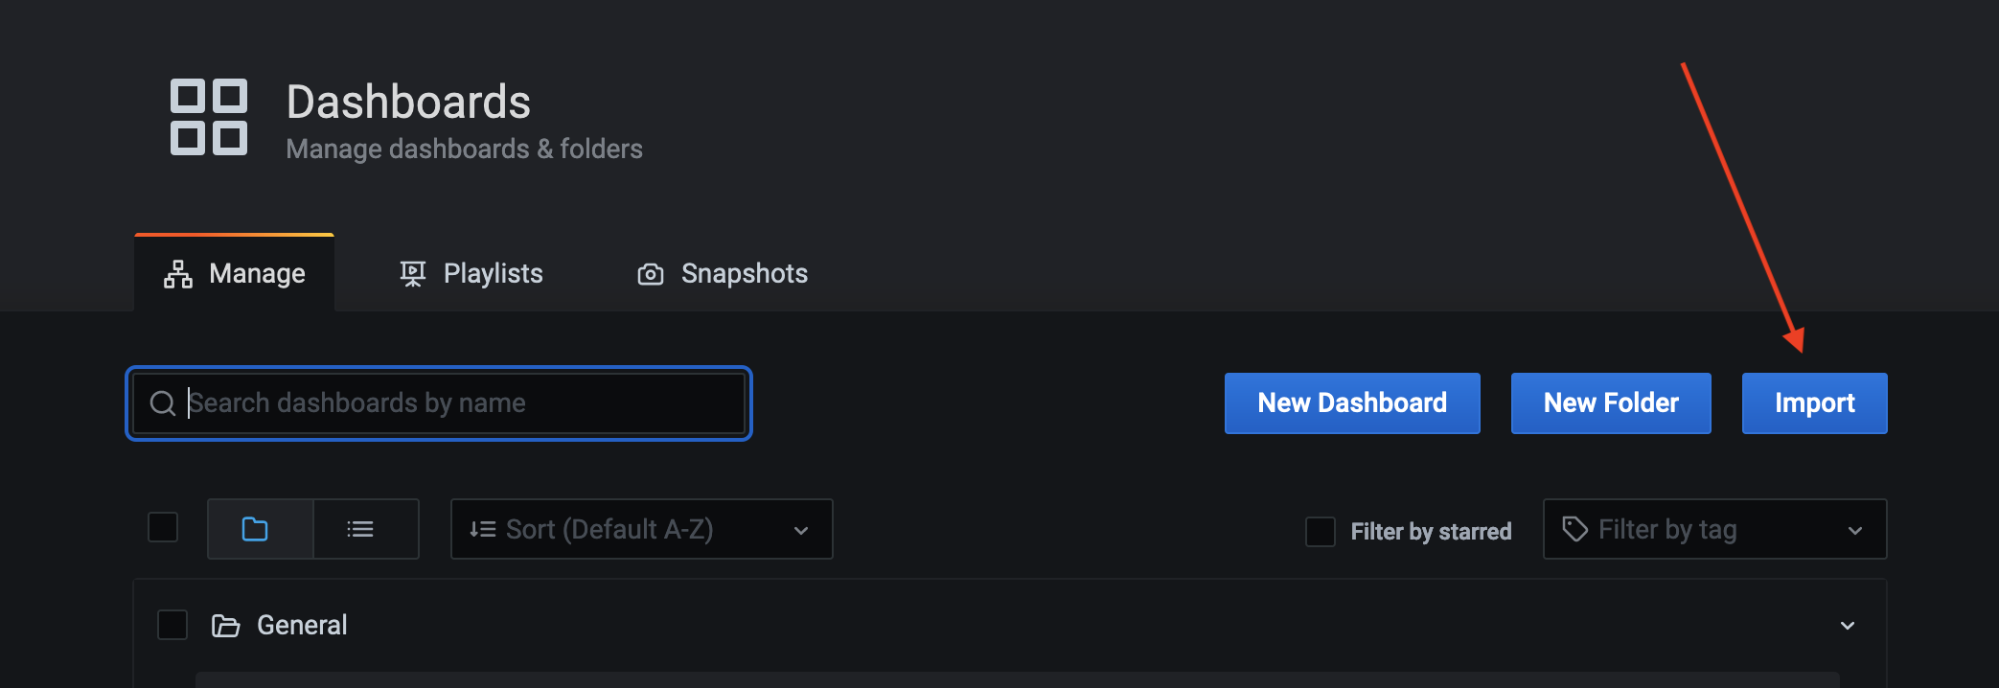
- Click Import.
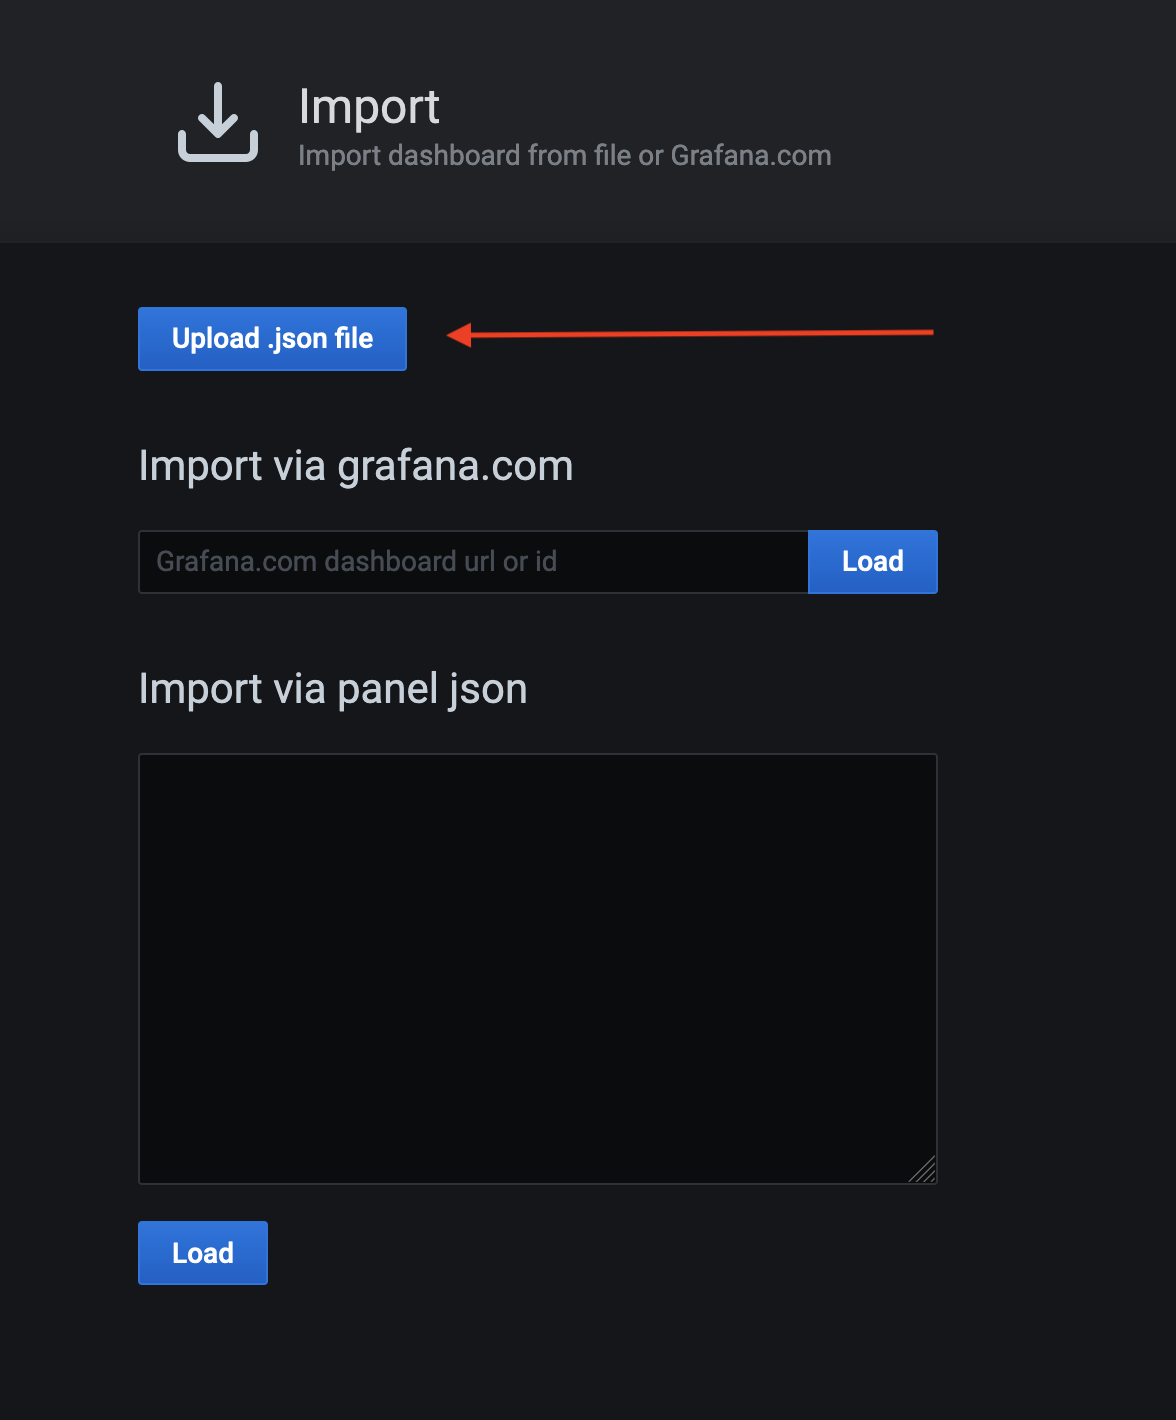
- Click Upload .json file now that we have our dashboards available locally.
- Import the relevant dashboard (kafka-overview.json, in this example).
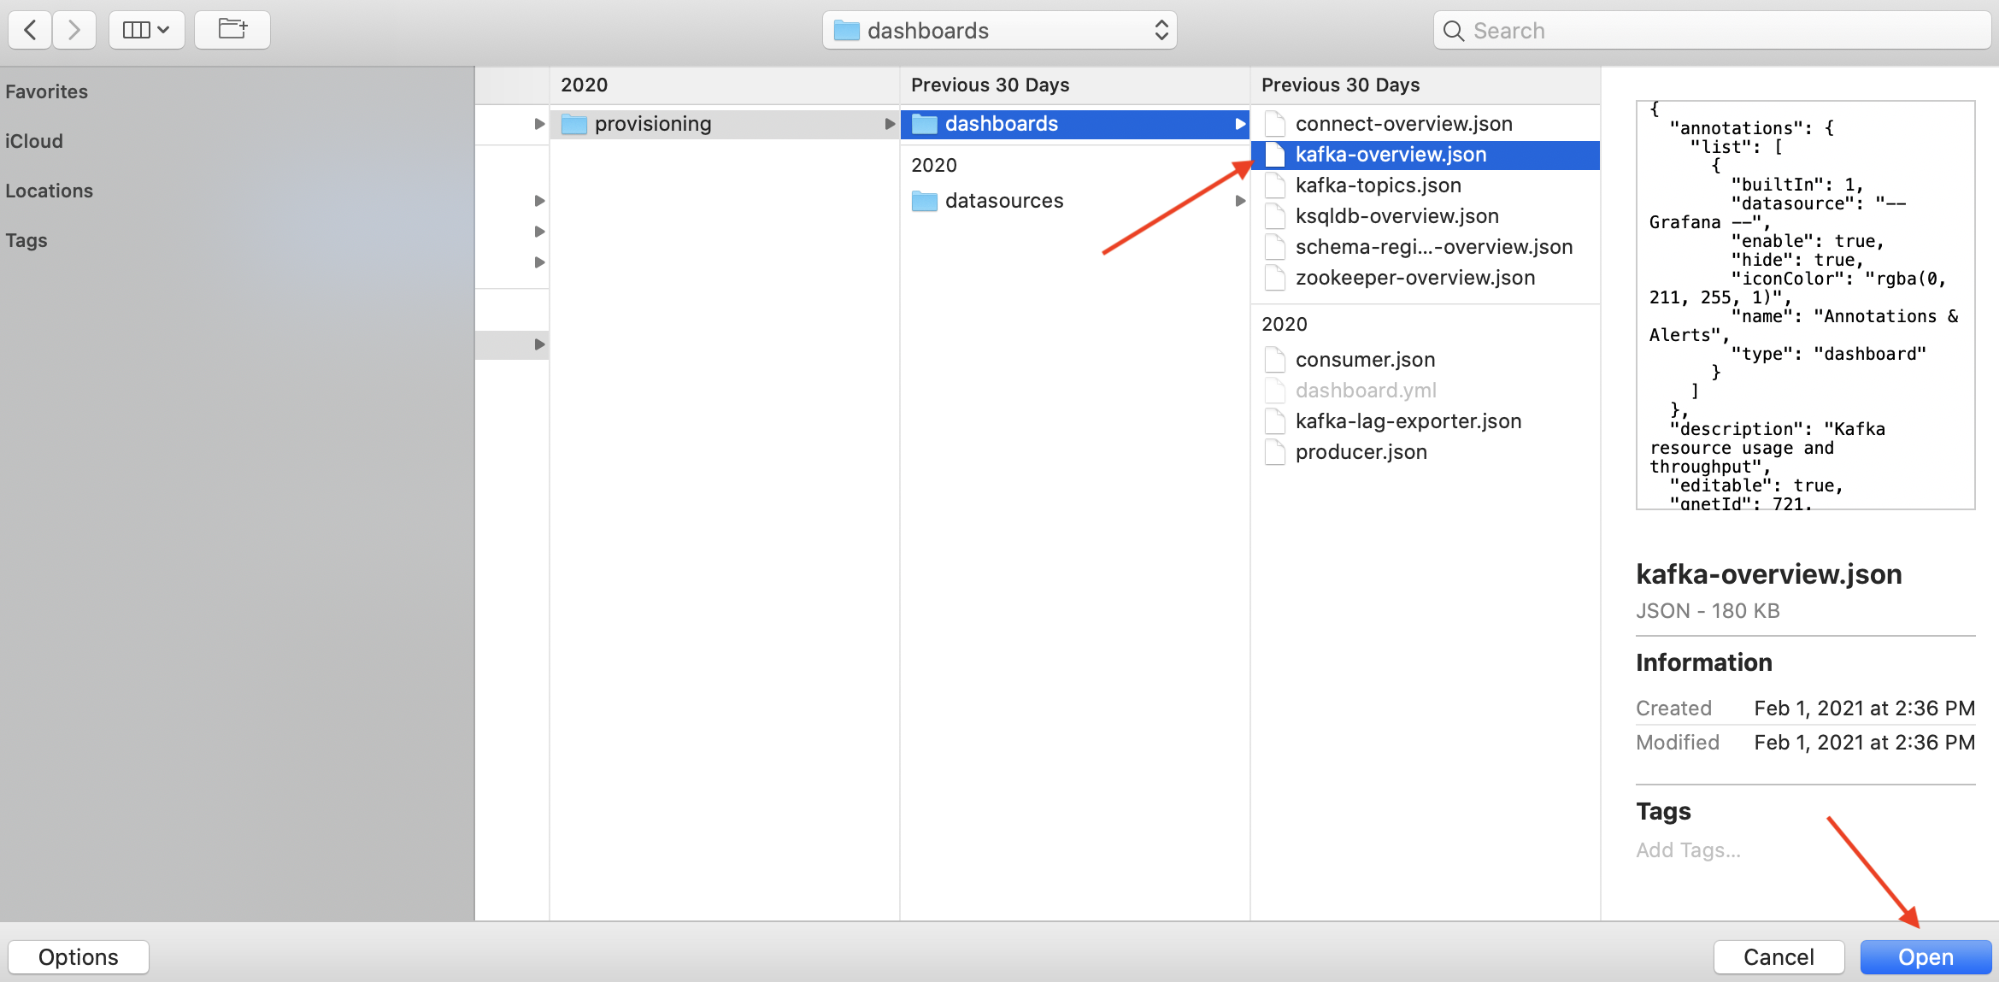
- Click Import, and the dashboard will be available for viewing and introspecting your Kafka broker metrics. Yay!
- Import the remaining dashboards, and you’re done!
If you’ve imported all of the JSON files, you should now have your dashboards populated via Prometheus. The dashboards are available for the following components:
ZooKeeper (filter available for environment):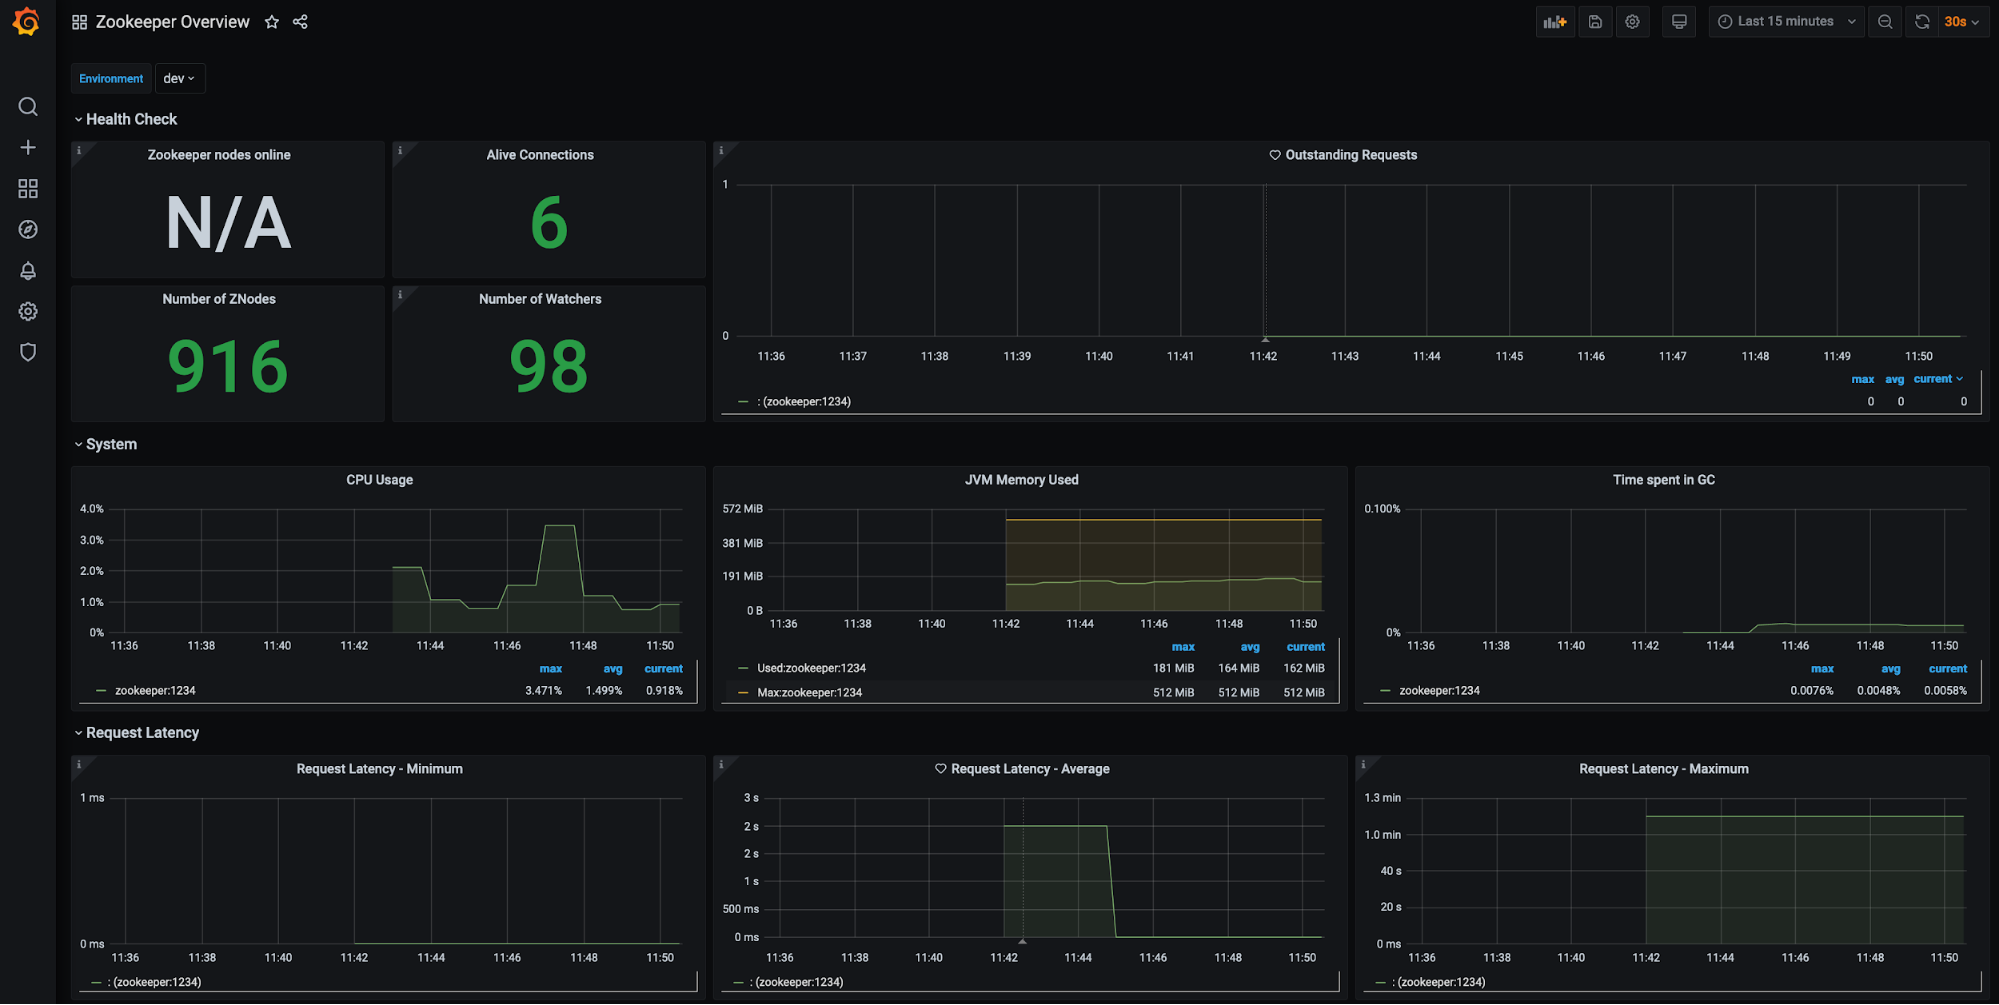
Kafka brokers (filters available for environment, brokers, etc.):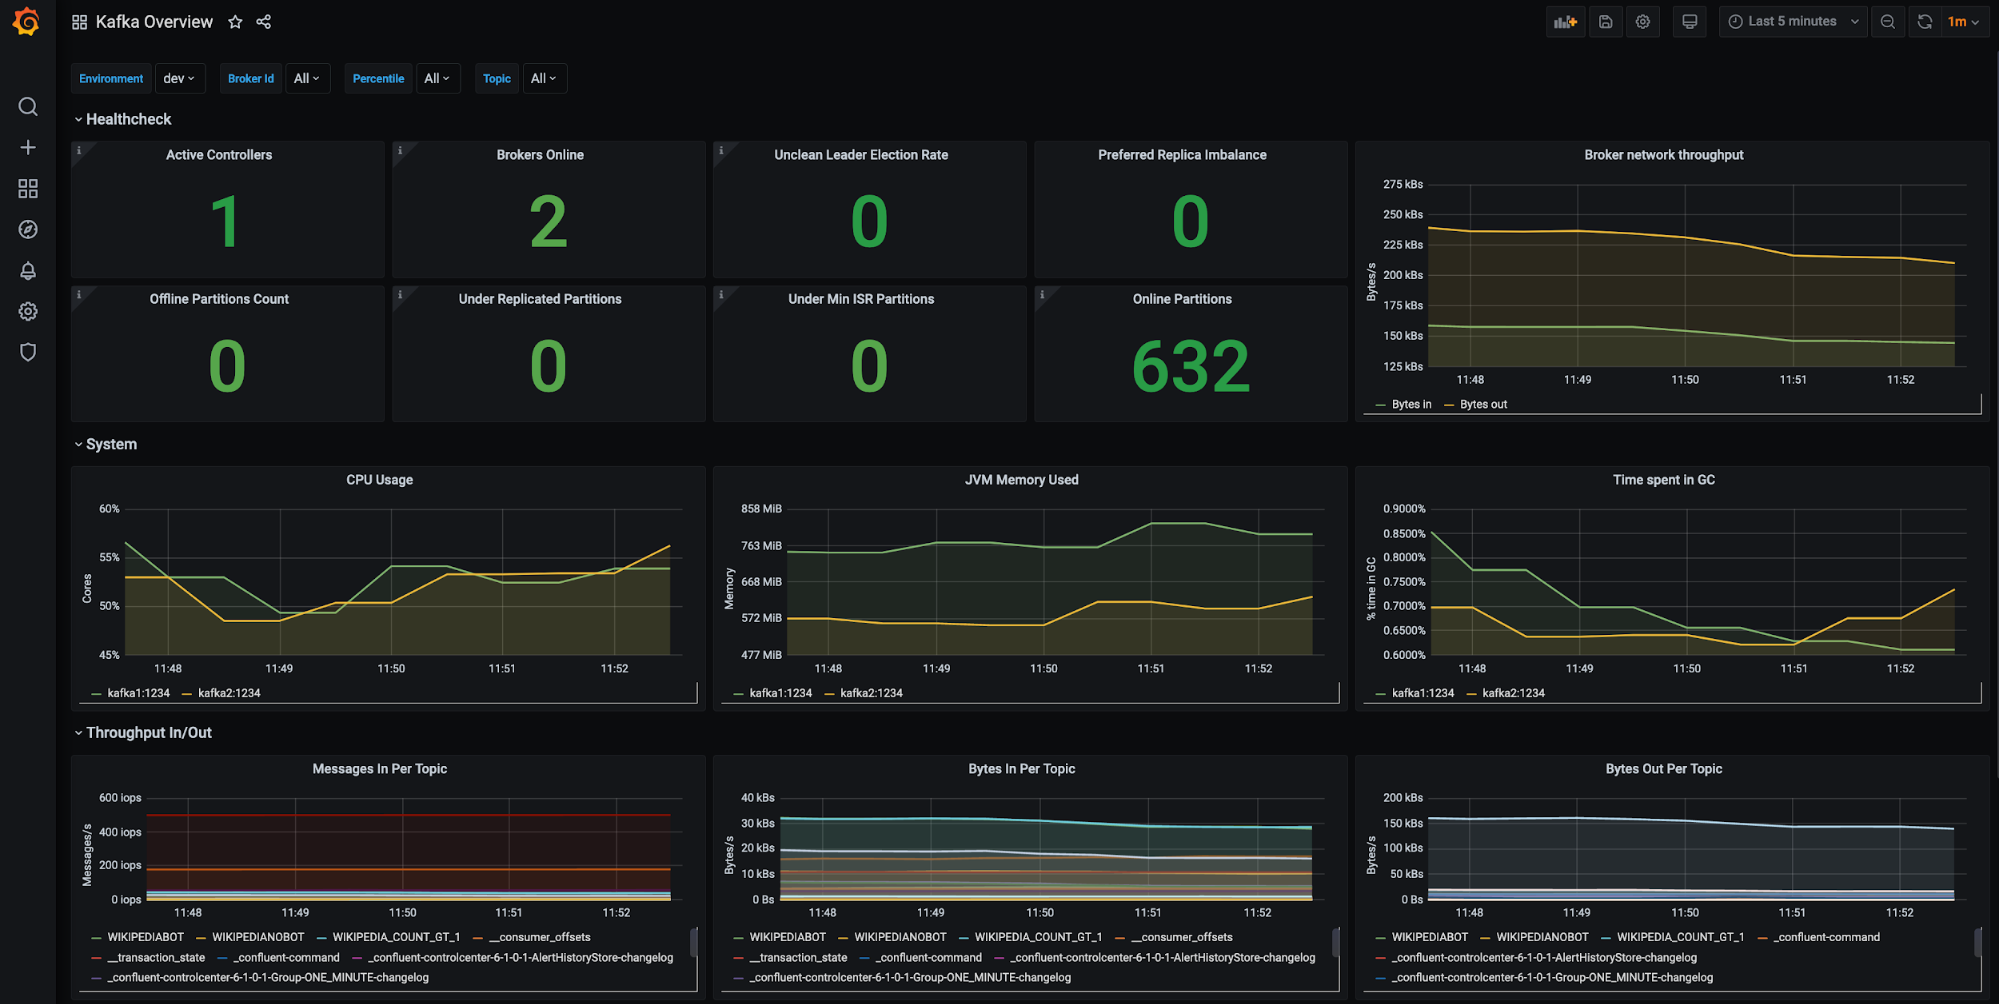

Confluent Schema Registry (filter available for environment):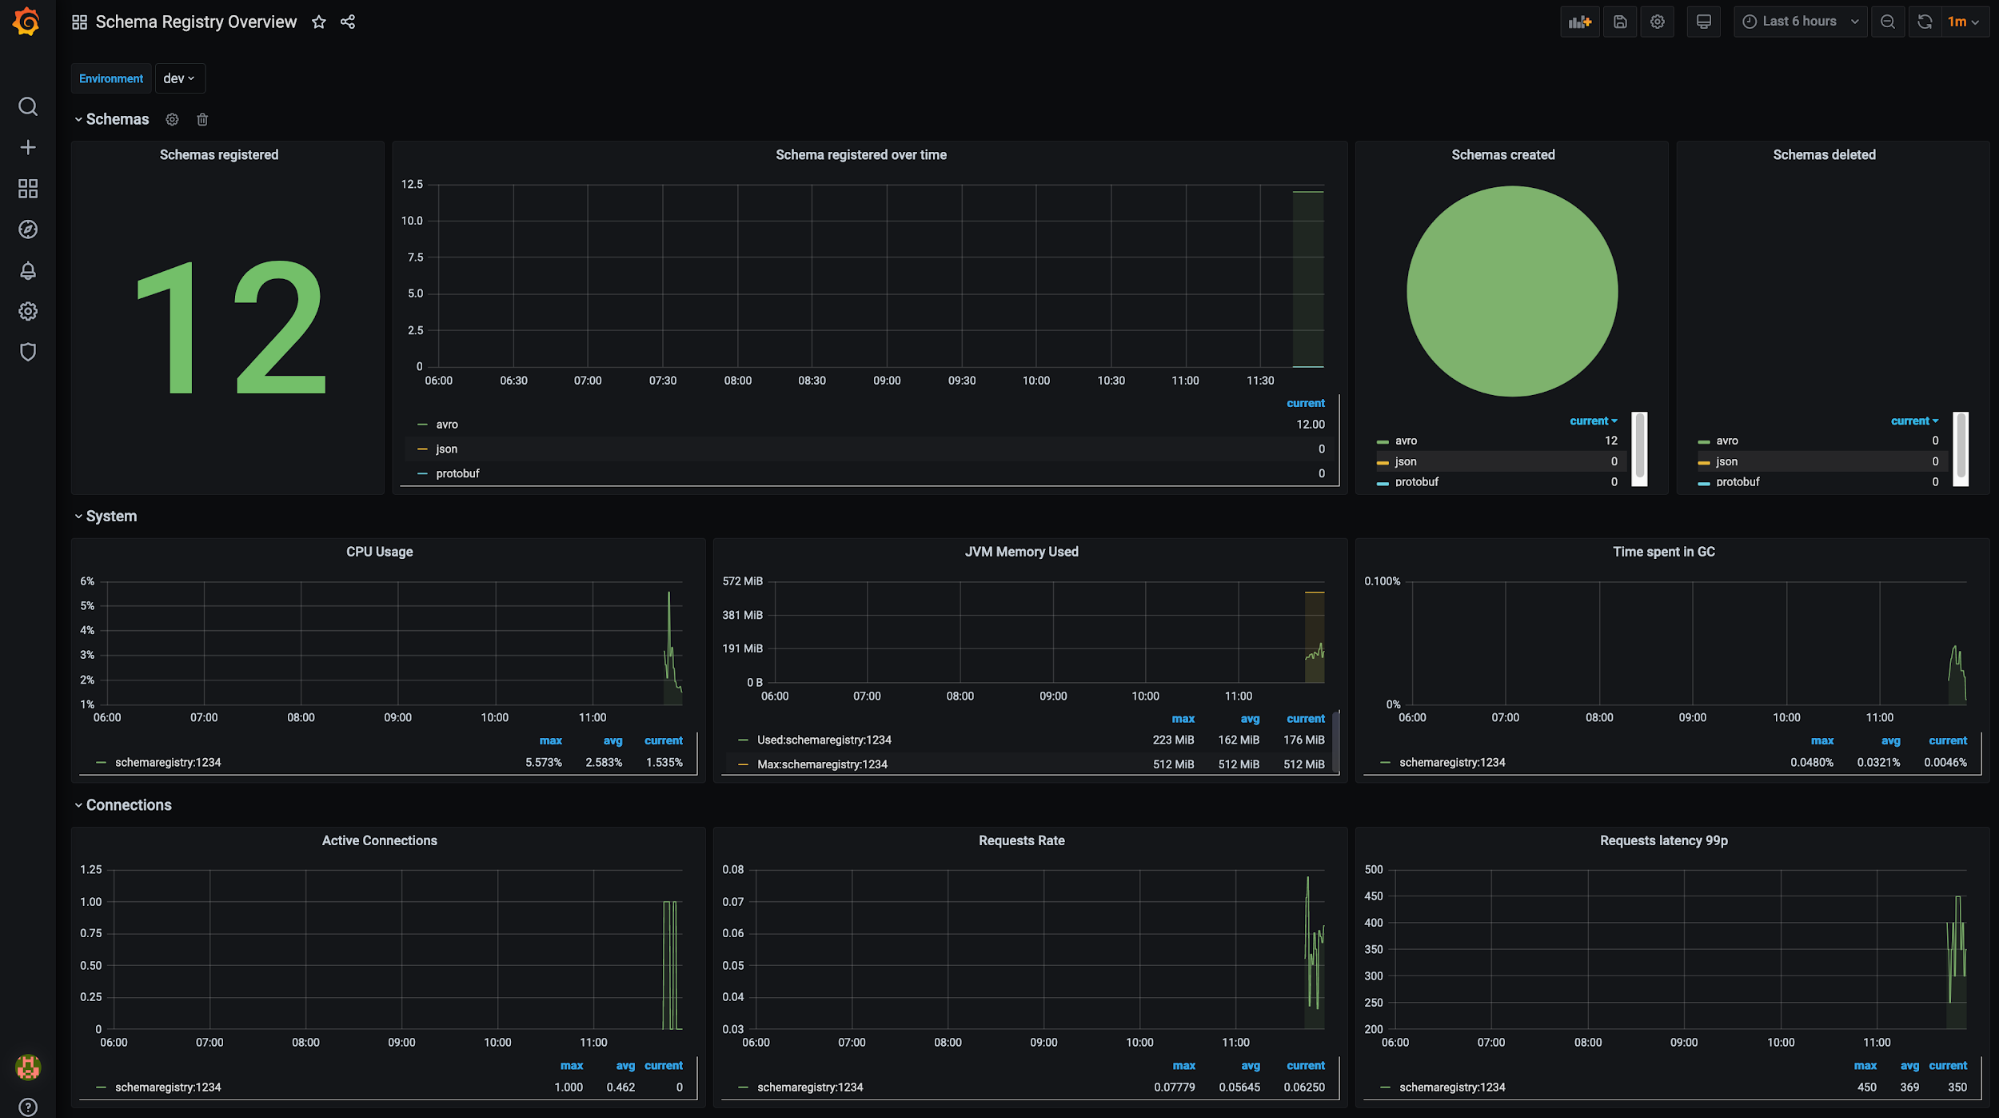
Kafka Connect clusters (filter available for environment, Connect cluster, Connect instance, etc.): 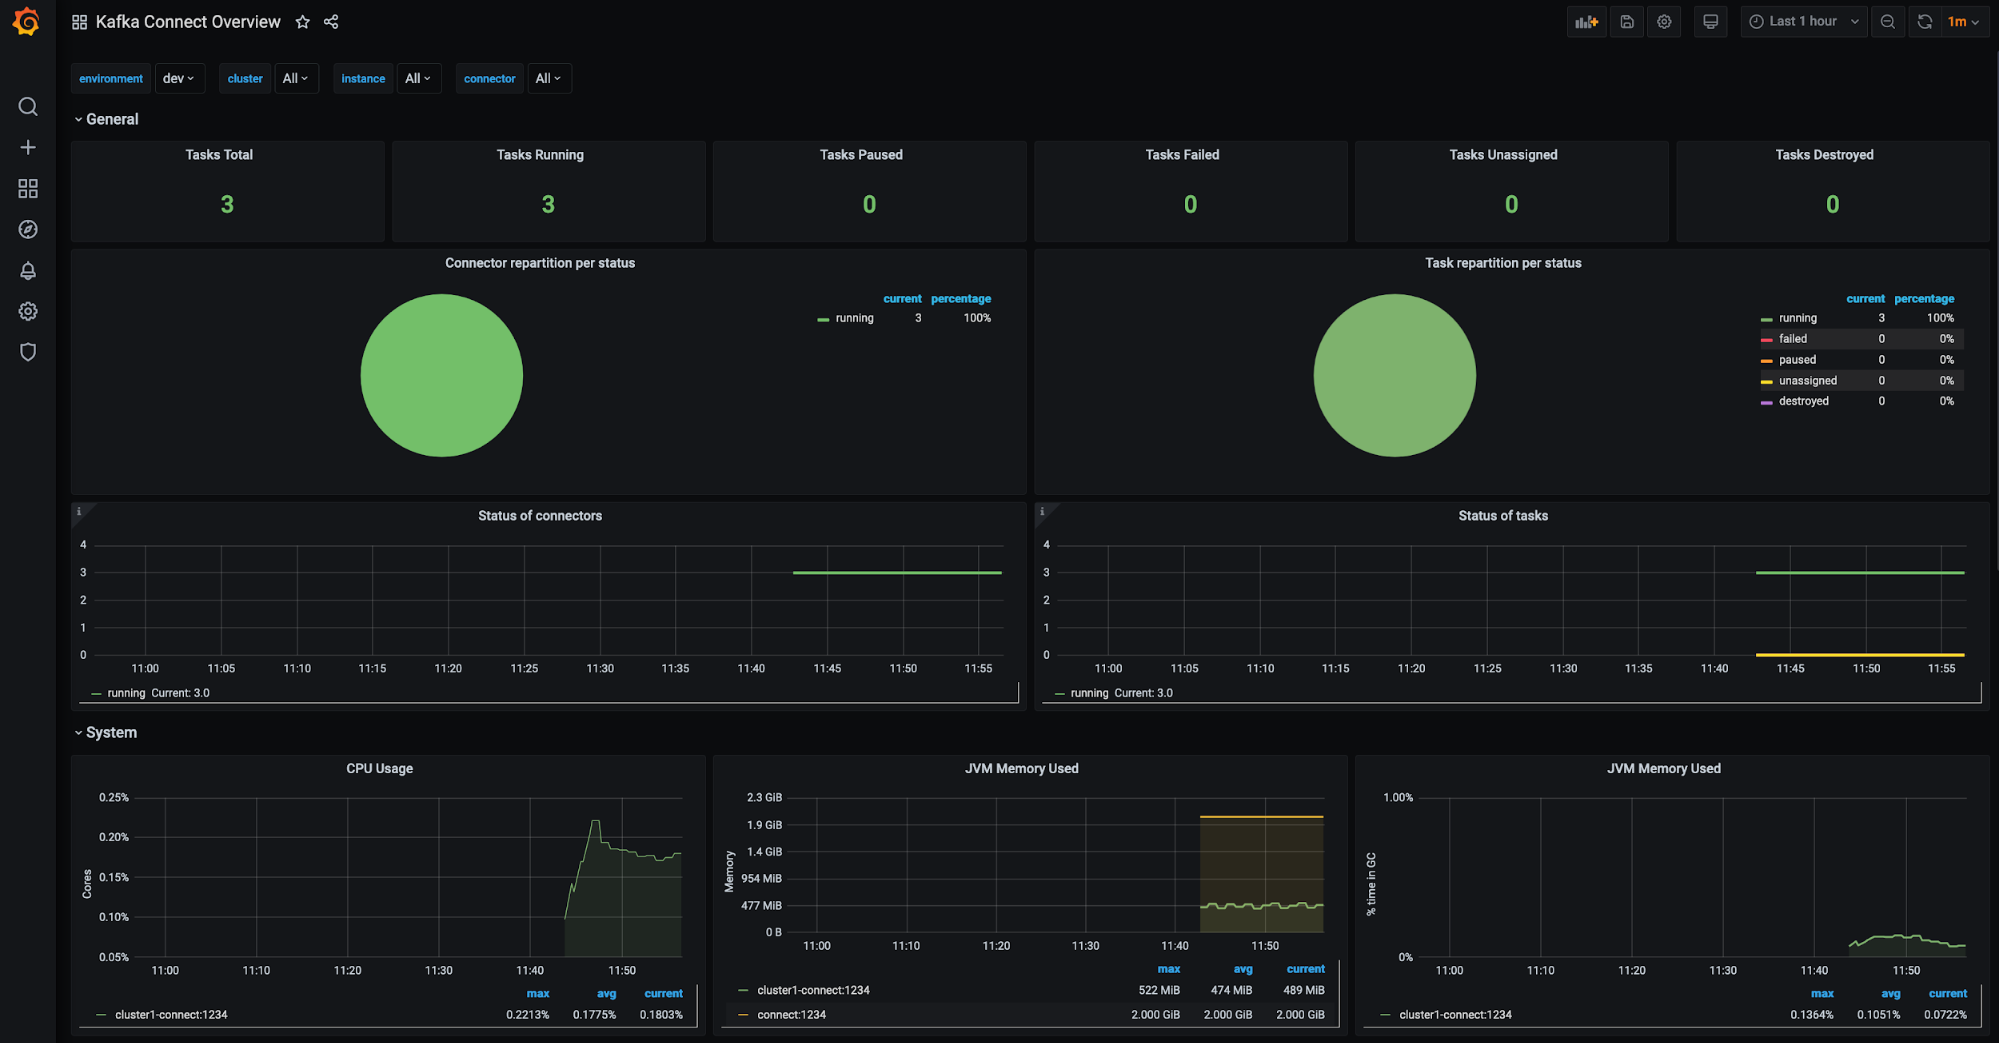
ksqlDB clusters (filter available for environment, ksqlDB cluster, etc.):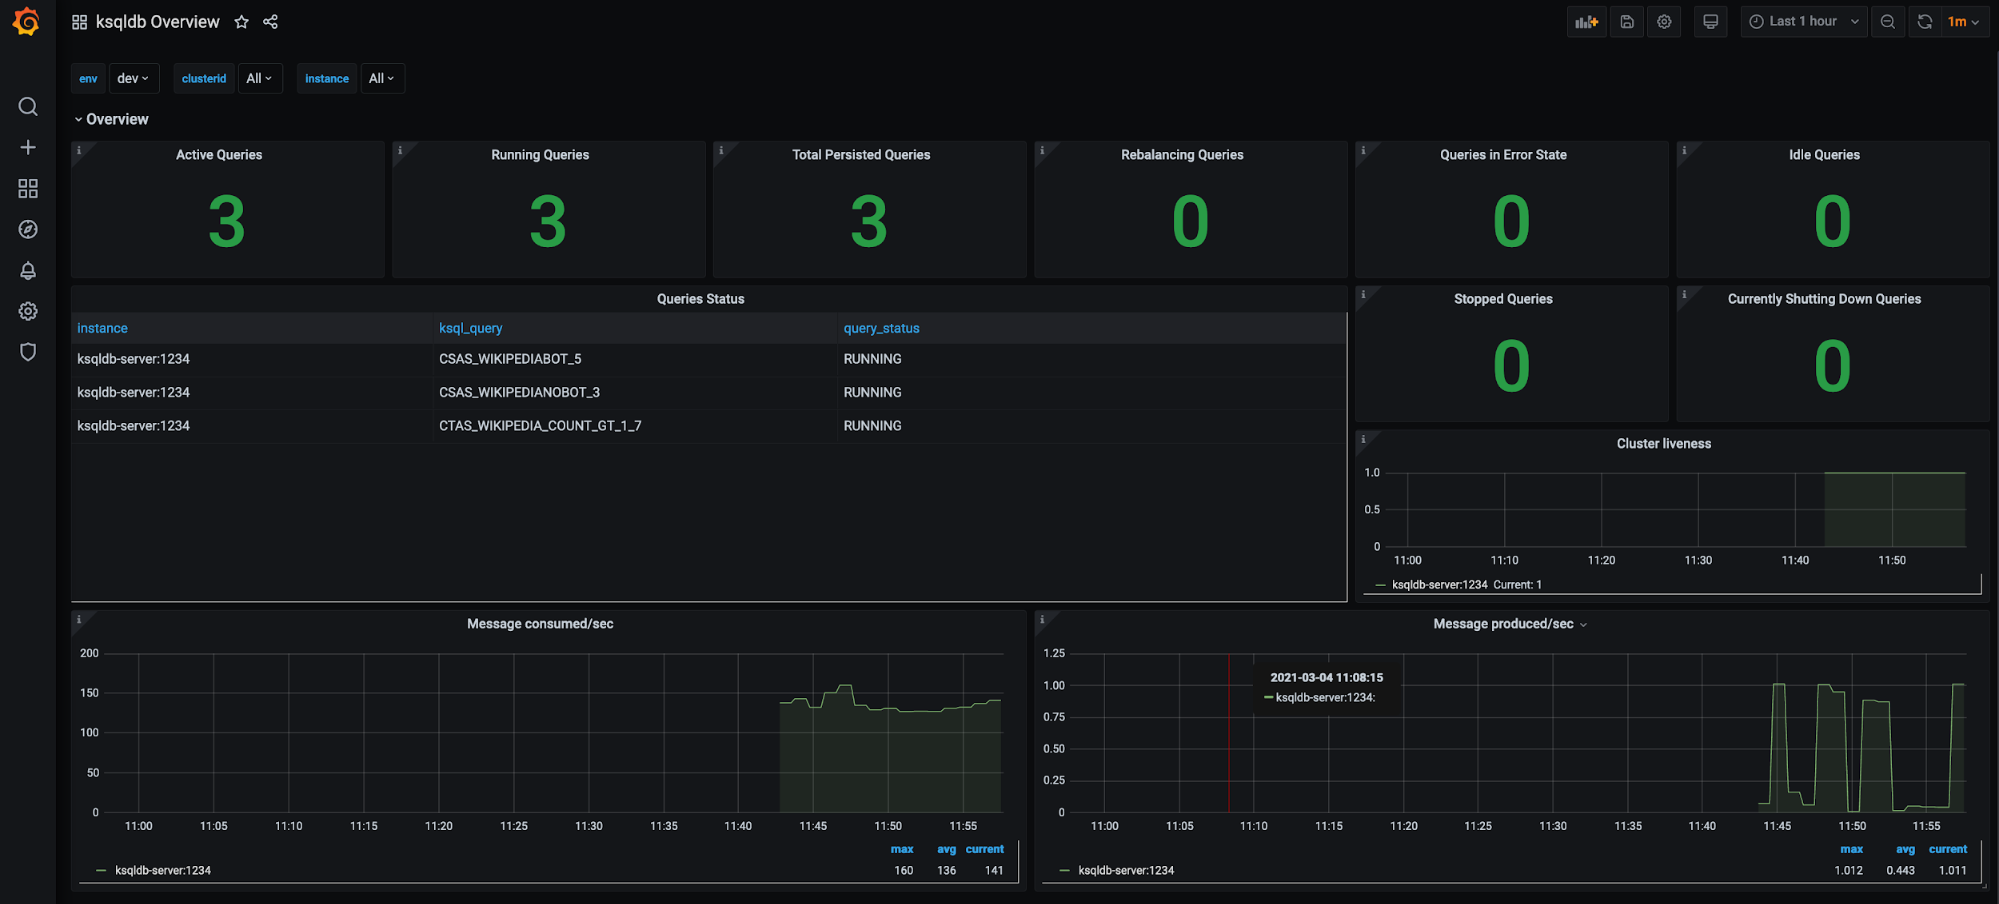
Kafka topics drill-down (filter available for environment and topics): 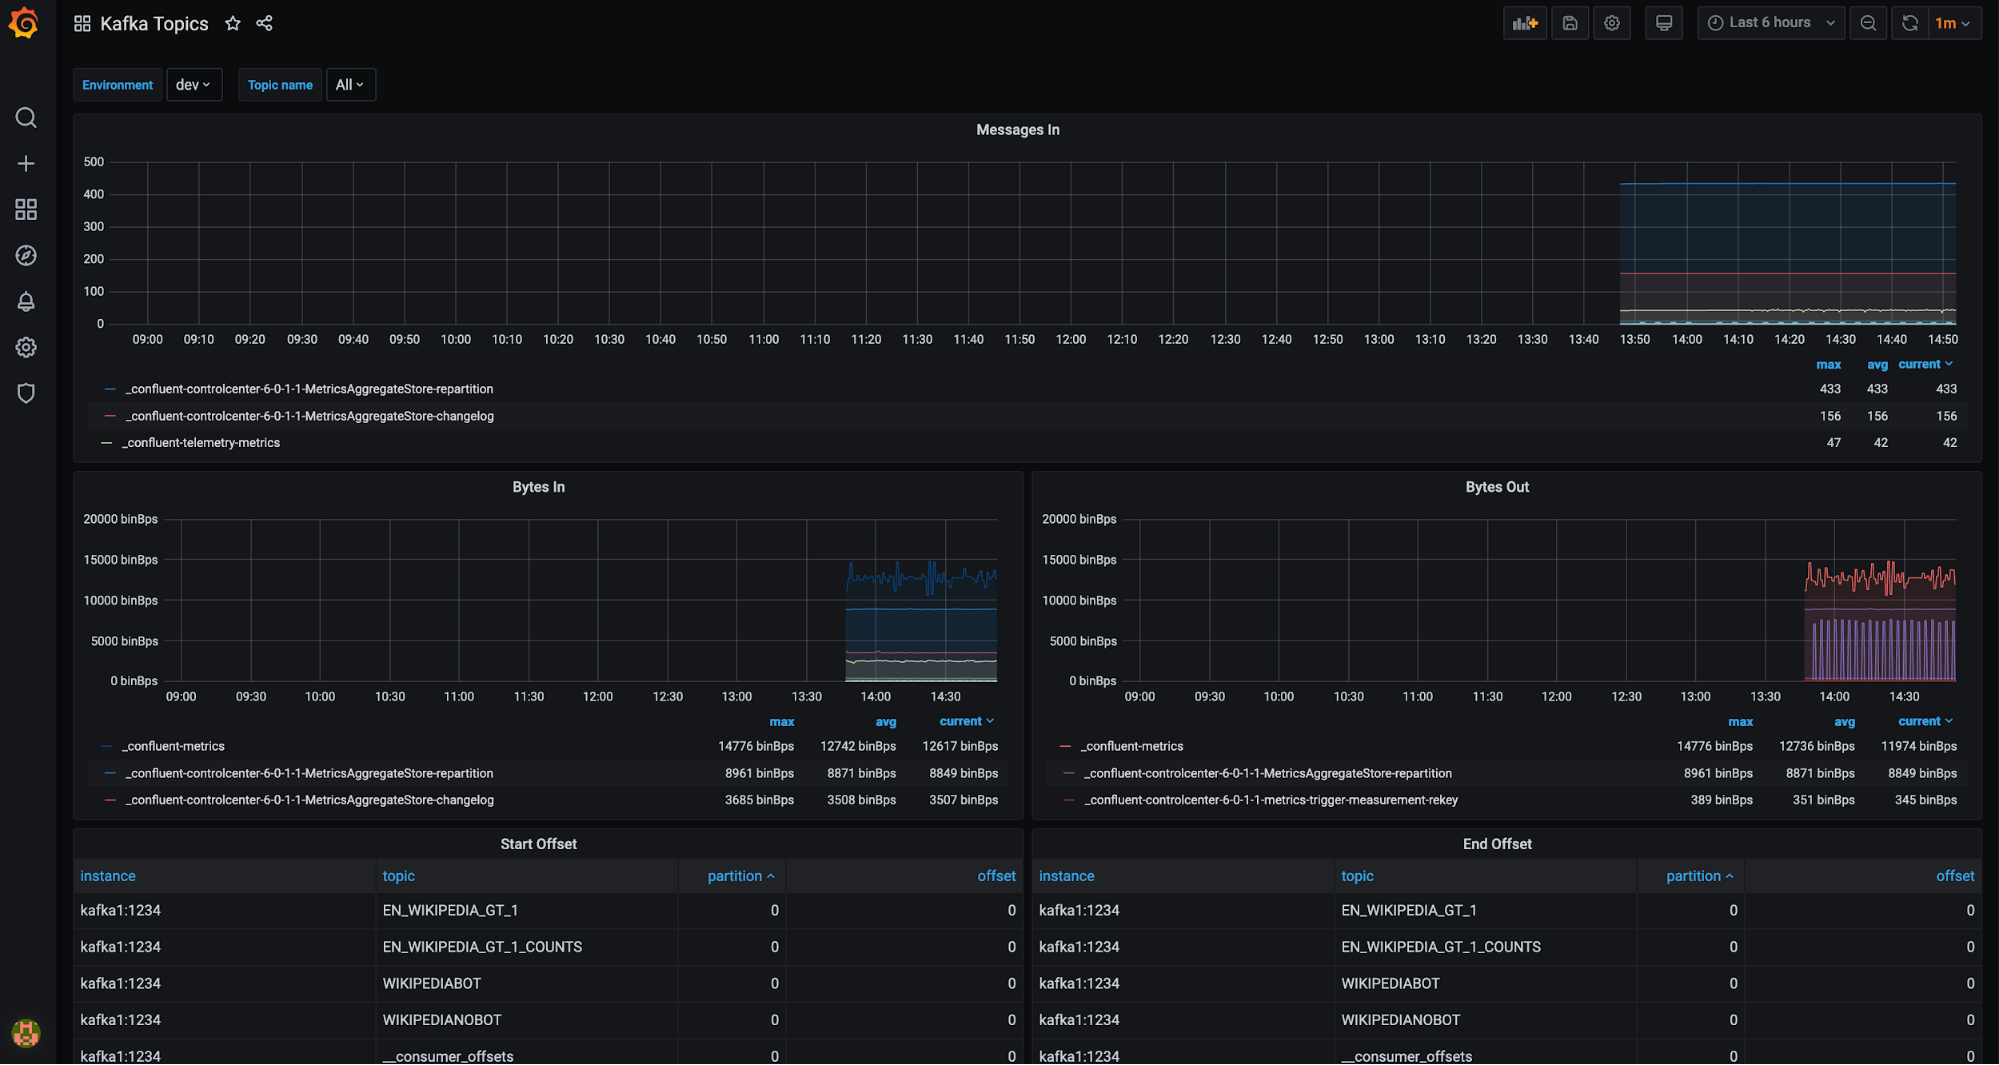
And more!
By following these steps, you can gather and visualize your Confluent metrics in real time.
Bonus
CP-Ansible is a set of playbooks that Confluent maintains and provides as an open source repository for streamlined Confluent installations. It’s an excellent resource if you’re installing or upgrading Confluent Platform and it includes all of the necessary Prometheus client items that we discussed. It adds the configurations, downloads the JAR file, and injects the arguments to make the setup process nearly effortless. You’ll just need to link the Confluent components’ metrics endpoints with the Prometheus scraper.
Conclusion
We’ve walked through how operators can scrape Confluent cluster metrics with Prometheus, and we’ve seen how to set up scrape rules for the components themselves. We added Grafana dashboards to chart and analyze cluster activity, as exemplified in the jmx-monitoring-stacks repository. If you find that one is missing a feature, please submit a pull request.
Next in part 2, we will walk through a tutorial on observability for Kafka Clients to Confluent Cloud. We’ll set up an environment with all of the necessary components, then use that environment to step through various scenarios (failure scenarios, hitting usage limits, etc.) to see how the applications are impacted and how the dashboards reflect the scenario so that you can know what to look for.
Interested in more?
If you’d like to know more, you can download Confluent to get started with a complete event streaming platform built by the original creators of Apache Kafka.
Avez-vous aimé cet article de blog ? Partagez-le !
Abonnez-vous au blog Confluent
New with Confluent Platform 7.9: Oracle XStream CDC Connector, Client-Side Field Level Encryption (EA), Confluent for VS Code, and More
This blog announces the general availability of Confluent Platform 7.9 and its latest key features: Oracle XStream CDC Connector, Client-Side Field Level Encryption (EA), Confluent for VS Code, and more.
Meet the Oracle XStream CDC Source Connector
Confluent's new Oracle XStream CDC Premium Connector delivers enterprise-grade performance with 2-3x throughput improvement over traditional approaches, eliminates costly Oracle GoldenGate licensing requirements, and seamlessly integrates with 120+ connectors...

