[Virtual Event] GenAI Streamposium: Learn to Build & Scale Real-Time GenAI Apps | Register Now
Highly Available, Fault-Tolerant Pull Queries in ksqlDB
One of the most critical aspects of any scale-out database is its availability to serve queries during partial failures. Business-critical applications require some measure of resilience to be able to continue operating when something goes wrong. We built ksqlDB to make it easy to create event streaming applications, so it’s no surprise that high availability was one of the most requested enhancements that we received. We’re excited to share some major progress we have made on this over the past few months, specifically how we’ve made pull queries remain highly available in the face of server failures.
What are we solving?
ksqlDB supports interactive querying of tables materialized by persistent queries via pull queries. ksqlDB leverages the Kafka Streams library, to provide fault tolerance and table state replication for these persistent queries.
Tables are backed by changelog topics to which persistent queries log updates done to the tables, as new events are processed. This way, the changelog topic acts as a distributed redo log for a table and replaying the changelog topic from the beginning recovers table state up to the last update. Both the table and changelog topic are partitioned, and each ksqlDB server in a cluster hosts some partitions for which it acts as the active server. During normal execution, pull queries are answered by the active server whose table partition contains the rowkey in the WHERE clause of the query.
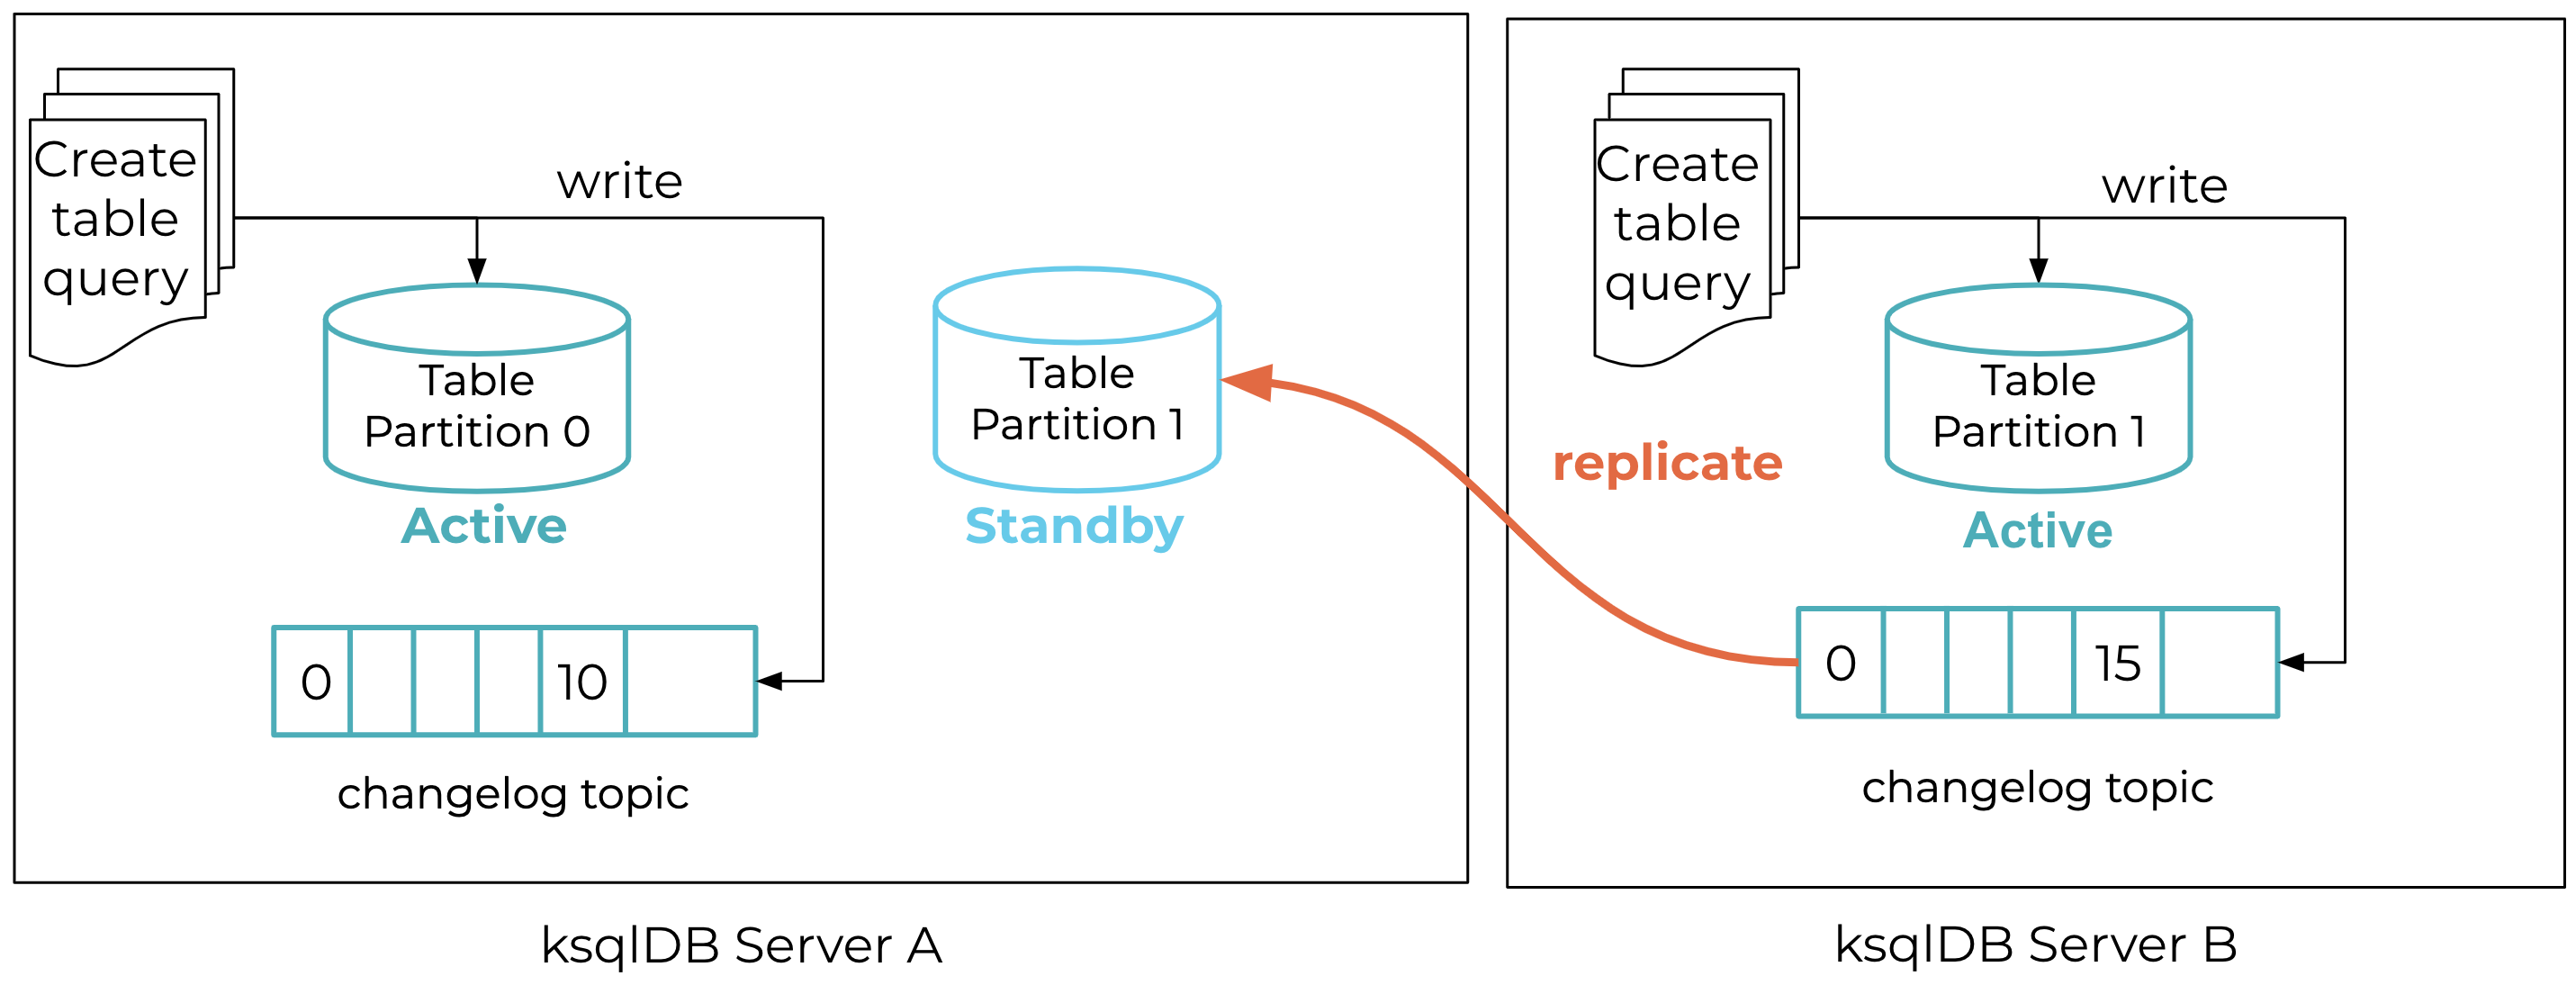
For fault tolerance and faster failure recovery, you can enable standby replication, in which a ksqlDB server, besides being the active for some partitions, additionally acts as the standby for other partitions. In this mode, a ksqlDB server subscribes to the changelog topic partition of the respective active and continuously replicates updates to its own copy of the table partition. For example, in Figure 1, server A is the active for partition 0 and standby for partition 1. Server B, on the other hand, is the active for partition 1. The standby table partition 1 at server A continuously replicates the changelog topic in the background (shown with the orange line).

Figure 1. Replication during normal execution of a persistent push query
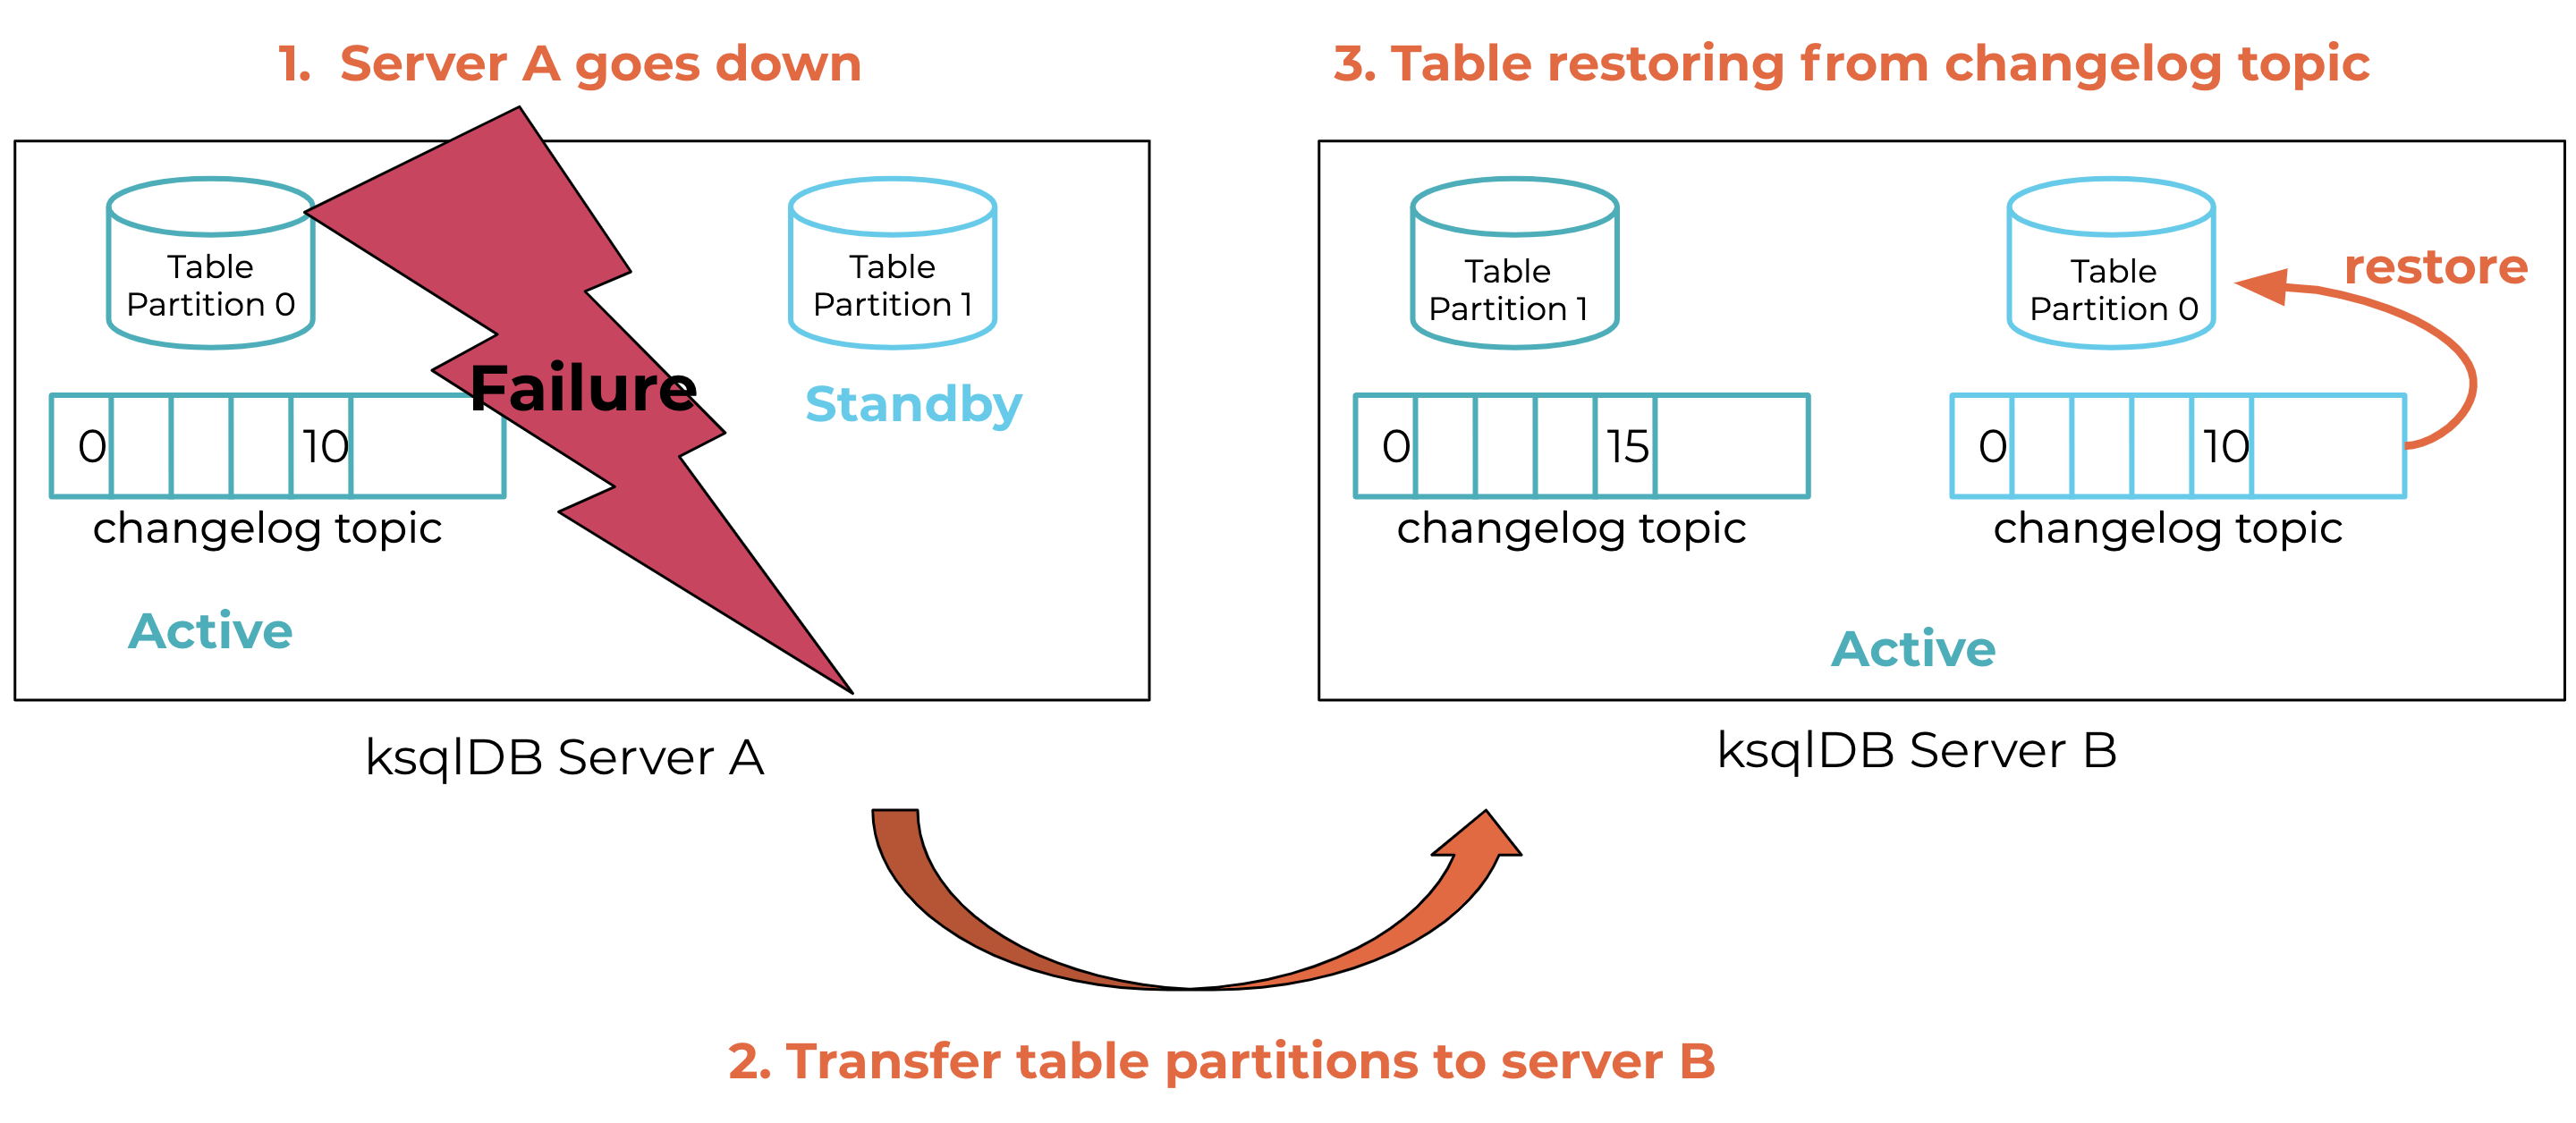
If the active server fails, Kafka Streams will perform the following steps, also shown in Figure 2, as part of the failure recovery process:
- Detect: initiate a rebalancing protocol after detecting that server A has failed
- Reassign: transfer ownership of server A’s table partitions to a newly elected server B, which can be either a standby replica (if configured) or one of the remaining servers
- Catch up: bring server B up to speed with the failed server by restoring B’s table from the changelog topic
 Figure 2. Failure recovery: transfer server A’s state to server B
Given this background, our goal was to engineer ksqlDB such that pull queries accessing underlying table partitions suffer minimal downtime as rebalances and server failures happen in the background. We divided this effort into solving two related sub-problems.
Problem 1: Improving availability
Detecting a failed ksqlDB server can take up to a few seconds, depending on your Streams consumer configuration (specifically session.timeout.ms and heartbeat.interval.ms). Reassigning is typically very quick, but the catch up can take anywhere from a few seconds to minutes depending on how behind the newly elected server is.
In prior releases, ksqlDB would fail pull queries during this rebalancing period to serve consistent results to the application. But for some applications, this unavailability window could be intolerable, and they might’ve been willing to trade off some consistency for more availability. In fact, there are plenty of datastores that have offered eventual consistency and successfully support a wide range of practical applications.
Problem 2: Bounding inconsistency
We could simply solve the first problem by allowing queries to access the underlying state during the rebalancing process while Streams standby replication or table restoration eventually brings the new server up to speed with the failed server. It would technically be correct to call this model eventually consistent.
However, in the event that the entire ksqlDB cluster’s table partitions were lost (or) in setups without standby replication, a full restoration would ensue, which could take many minutes to even hours if the tables are very large. Queries issued in this scenario could return stale values that are not practically useful to an application. Hence, there needs to be a mechanism for queries to specify how much inconsistency they are willing to tolerate.
Consistency or availability?
For any new distributed database coming out, it’s a useful (and fun) exercise to explain its architectural trade-offs using the CAP theorem, which states that a system can only satisfy two out of the three guarantees (consistency, availability, and partition tolerance), at all times. ksqlDB has historically been a CP system, trading off unavailability during rebalancing for the sake of serving a consistent result (i.e., successive pull queries on the same rowkey do not return older values). With the new design outlined below, you can also configure it as an AP system to trade inconsistency (within specified bounds) for availability, though once the inconsistency exceeds the bounds, it returns to being a CP system.
The newer PACELC model, which distinguishes a system’s behavior during normal operations and in the presence of network partitions, is another way of understanding these trade-offs. As previously explained, a write into a ksqlDB table partition gets written both locally into a server’s disk and also to a replicated log (i.e., an Apache Kafka® changelog topic), which can then be asynchronously replicated out to another standby server. During normal operations, ksqlDB chooses latency (L) over consistency (C), which differs from the modern distributed datastores that employ synchronous replication (e.g., Paxos and Raft).
Given that ksqlDB is built for processing event streaming data at an order of magnitude of higher throughput than typical OLTP database workloads, favoring latency of writes over synchronously keeping a standby replica up to date seems like a good trade-off. Under network partitions, ksqlDB has historically favored consistency (C) by failing queries until a newly elected active server is fully caught up. Now, you can choose availability (A) as well by allowing reads from standby replicas.
Design and architecture
The unavailability window during failures is dominated by the table restoration time and the failure detection time. Table restoration time can be significantly reduced by enabling standby replication. The failure detection time is directly influenced by Streams consumer configuration and by default can take up to 10–15 seconds. We’ll save standby replication tuning for a future discussion and focus the remainder of this post on how we improved the failure detection time.
Failure detection
Even though we could improve uptime by tuning the Streams consumer configuration aggressively, it would drastically increase the amount of RPC calls to Kafka brokers. This cost multiplied across hundreds of ksqlDB servers sharing a given Kafka cluster would pose a serious scalability problem. A better approach is implementing a failure detection protocol local to each ksqlDB cluster.
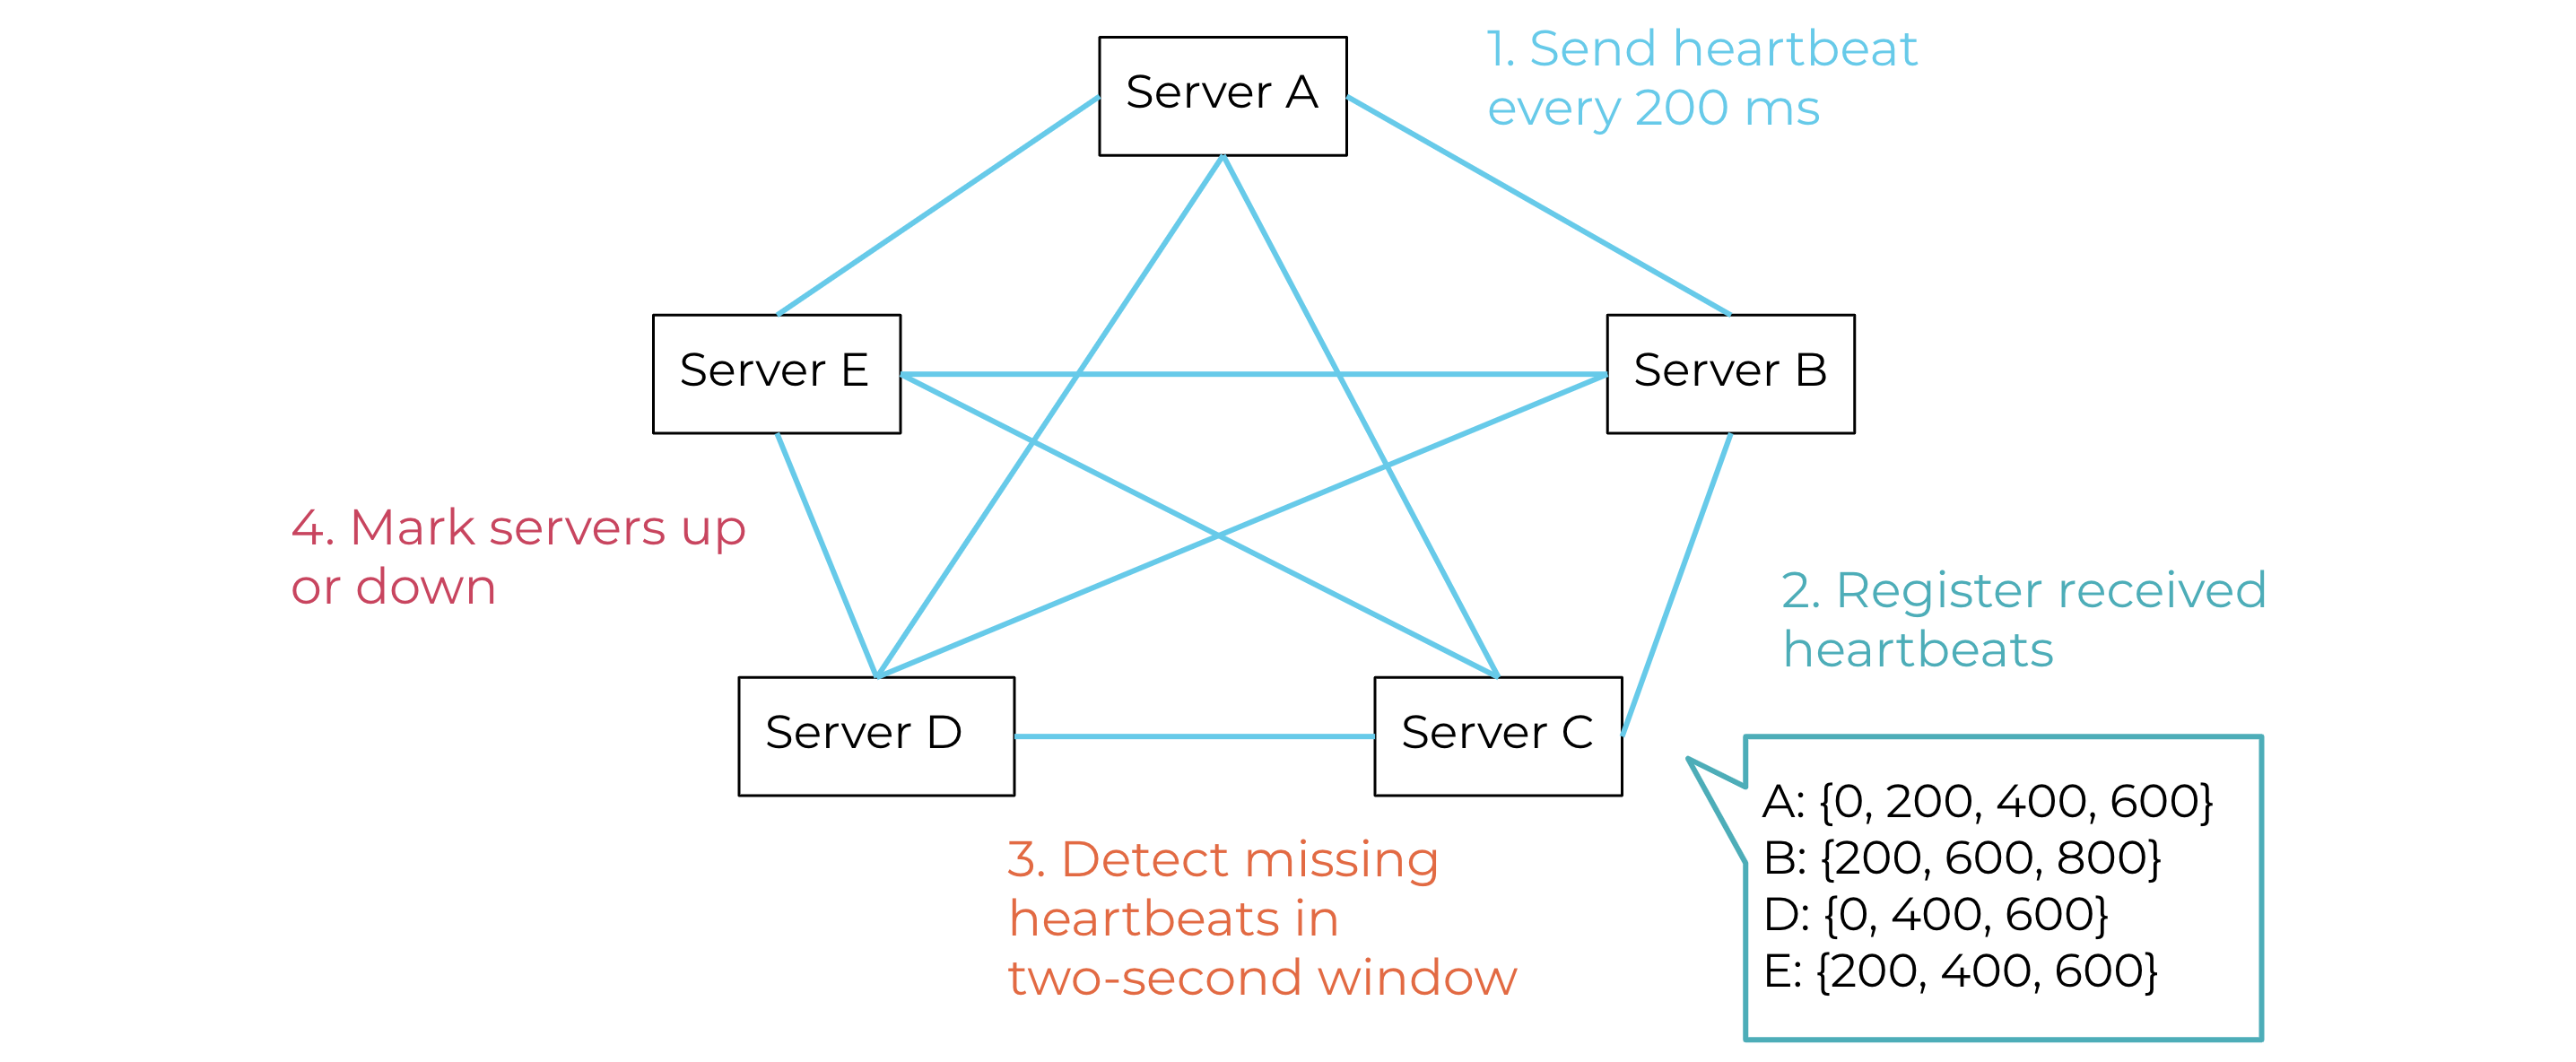
Given these requirements, we implemented failure detection via heartbeating. Every ksqlDB server broadcasts its heartbeat using the existing REST API and leveraging the N2 mesh that already exists between the servers, as shown in Figure 3. The heartbeats must be lightweight so that a server can send multiple heartbeats per second, which will provide more data points to implement a well-informed policy for determining when a server is up and when it is down. ksqlDB servers register the heartbeats they receive and process them to determine which server failed to send its heartbeat within a window of two seconds, for example. Using this information, a server can determine the health status of the other servers in the cluster and avoid wastefully routing queries to failed servers.
 Figure 3. Failure detection: mesh of ksqlDB servers sending and processing heartbeats
Standby routing
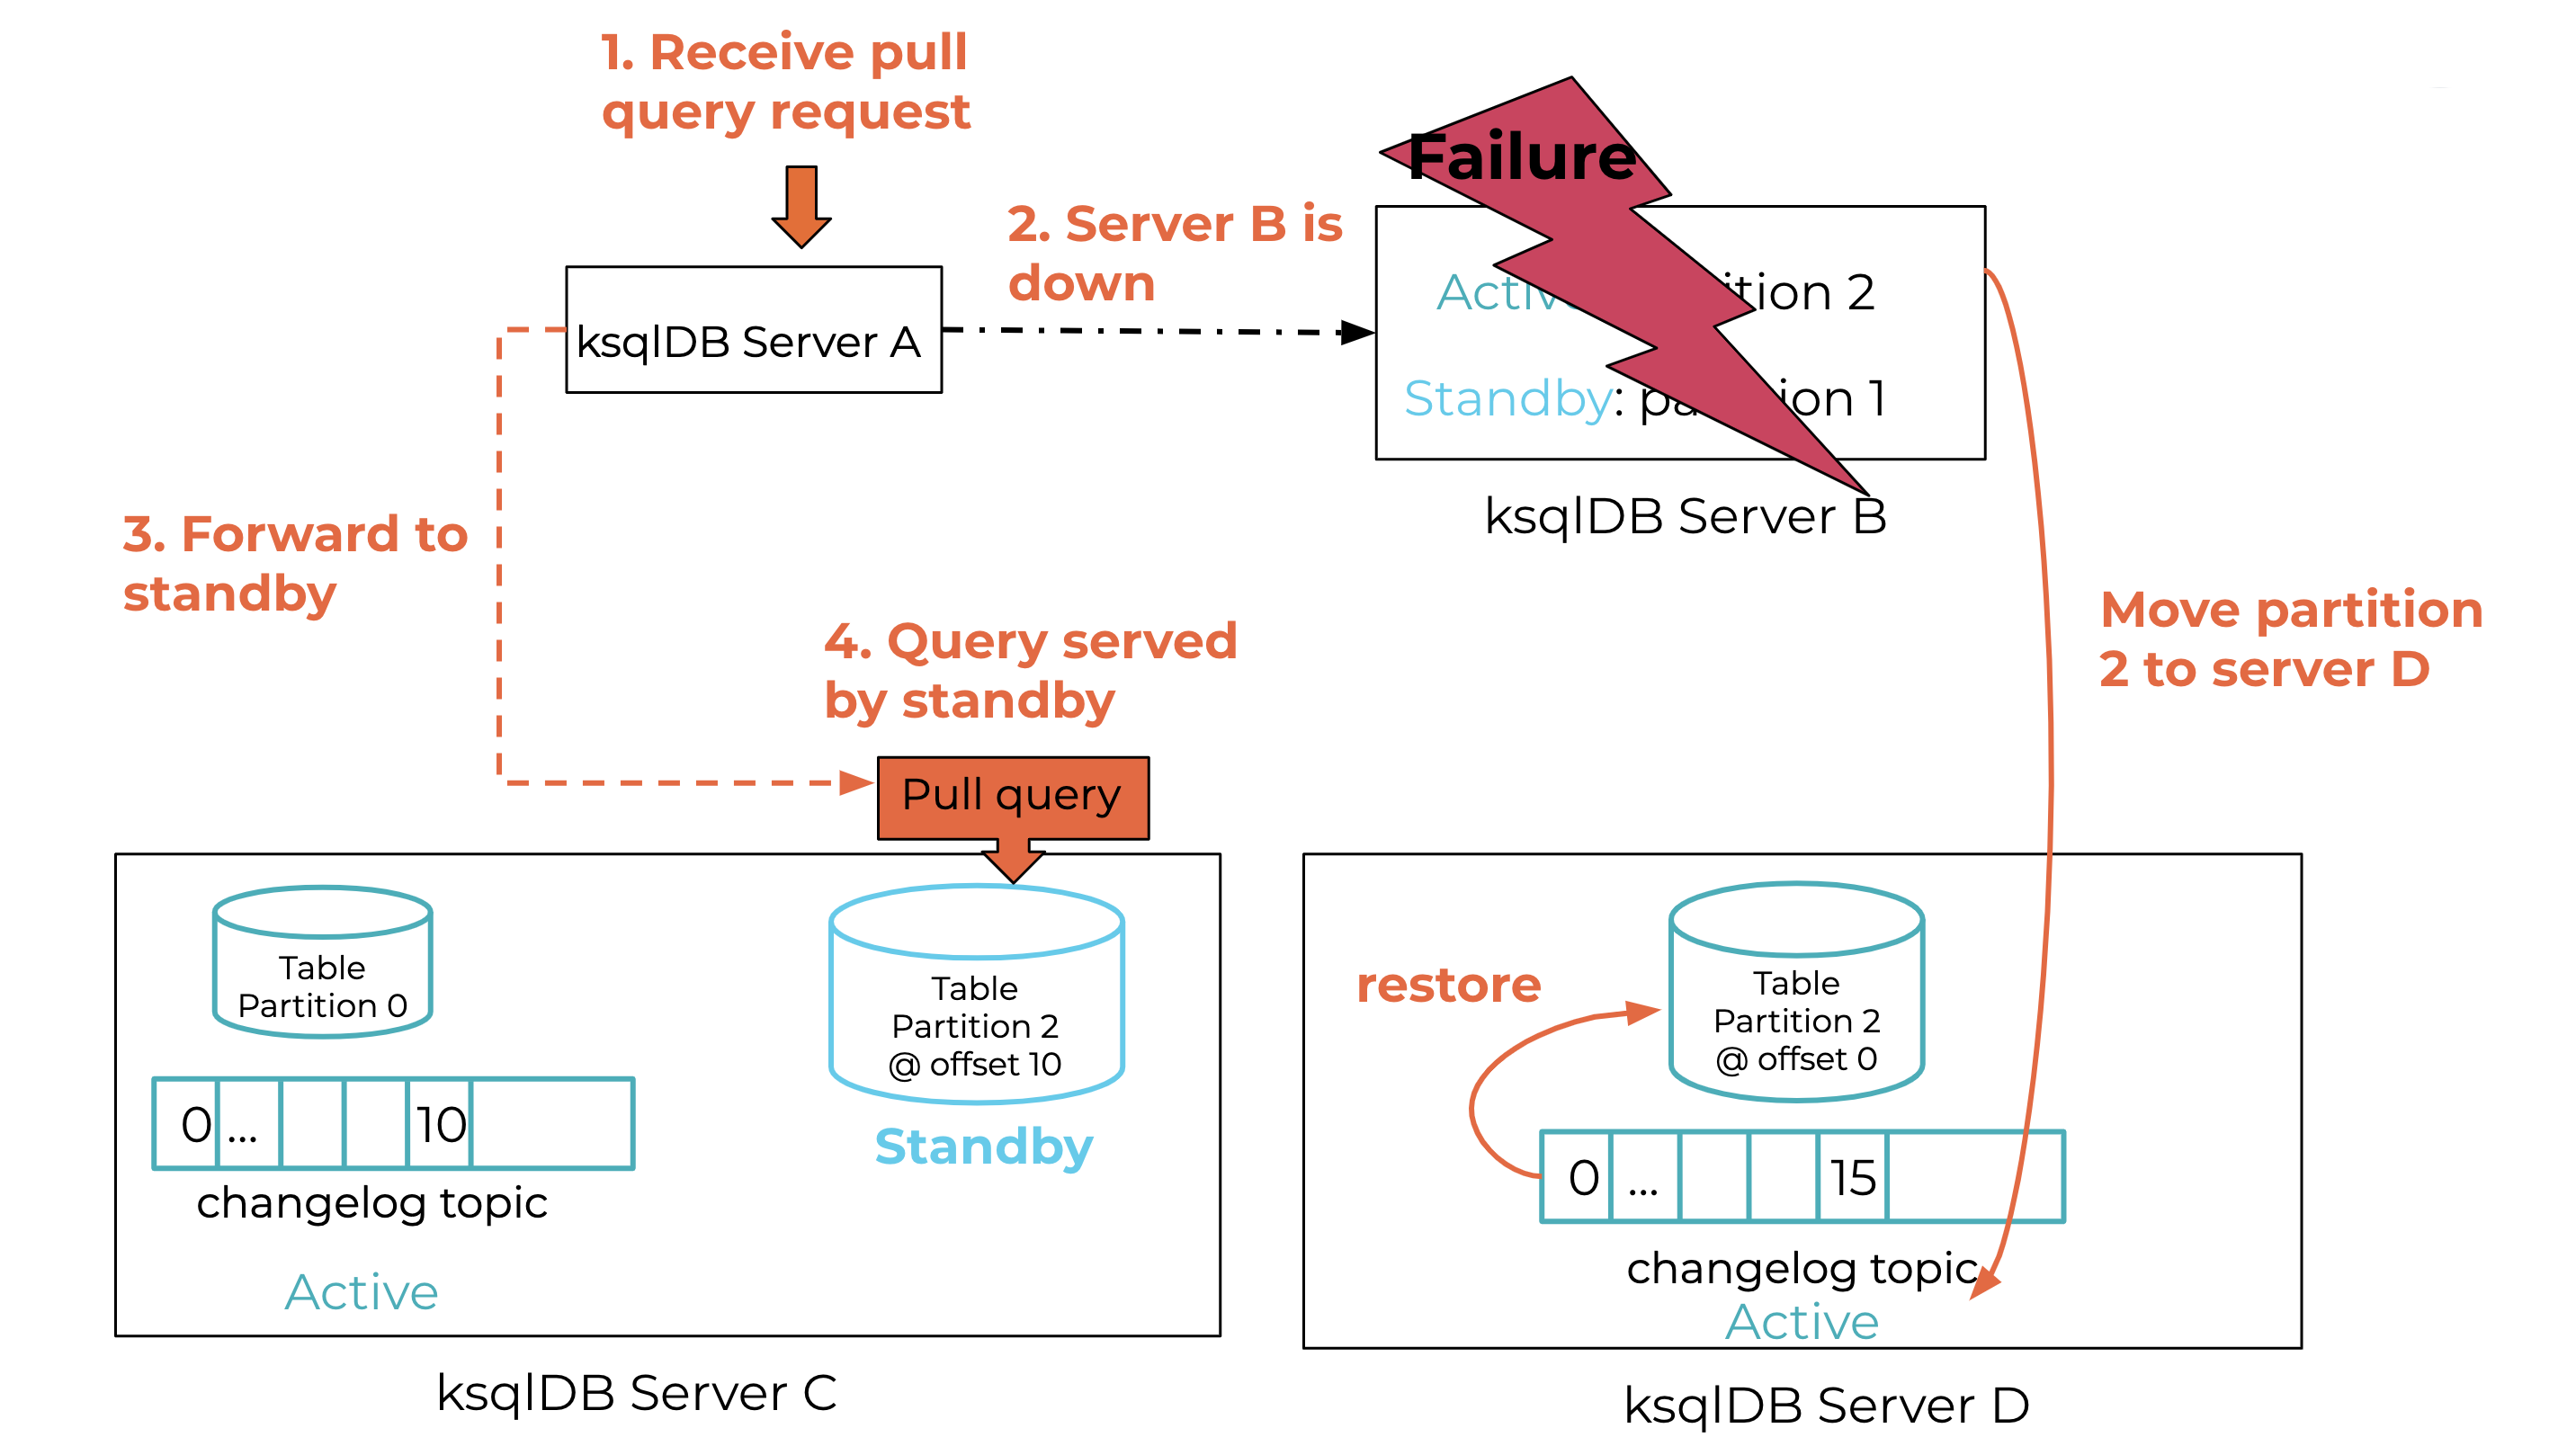
In addition to detecting failures quickly, pull queries that would otherwise fail are now routed to other servers that host the same partition, whether active or standby. When ksqlDB server A, shown in step 1 of Figure 4, receives a pull query request for table partition 2, it needs to determine which of the other servers in the cluster are hosting that partition and then forward the request to it. If that destination server (server B) is down, as shown in step 2, server A needs to forward the request to another server, either a standby server (server C) or a newly elected active (server D). KIP-535 provides the ability to obtain such standby routing information using the Streams API.
 Figure 4. Pull query routing during failure recovery
Lag-aware routing
To tune the quality of the results of query evaluation, we need to allow filtering based on how stale the data is, i.e., how big the lag of the table is with respect to the changelog topic. In our example in Figure 4, server C’s table is at offset 10 out of 15, whereas server D is at offset 0 since it just started restoring. Hence, A forwards the request to C, as shown in step 4. Future pull queries on partition 2 can be served by D once its table is sufficiently restored.
Every ksqlDB server (active or standby), thanks to KIP-535, has the following information:
- Local current offset position per partition: the current offset position of a partition of the changelog topic that has been successfully written into the respective table partition
- Local end offset position per partition: the last offset written to a partition of the changelog topic
Every server periodically broadcasts (via the REST API) their local current offsets and end offset positions, much like with heartbeating but less frequently. Given the above, a ksqlDB server knows which of the other servers in the cluster are alive and how caught up their tables are. This facilitates lag-aware routing where server A can quickly determine that server B is down without sending a request to it and waiting for timeout. Then server A can make a well-informed decision about where to route the request, whether it should be server C or D depending on who has the smallest lag for the given key in the pull query.
Configuring ksqlDB for high availability
You can enable highly available pull queries for release 0.8.1 or above by setting the following configuration parameters in the ksqlDB server’s configuration file:
- Enable standby servers by setting ksql.streams.num.standby.replicas to a value greater or equal to 1.
- Enable forwarding of pull queries to standby servers when the active is down by setting ksql.query.pull.enable.standby.reads to true.
- Enable the heartbeating service so that servers can detect failure faster and provide a sub-second, real-time cluster membership by setting ksql.heartbeat.enable to true.
- Enable the lag reporting service so that servers can filter results based on their inconsistency by setting ksql.lag.reporting.enable to true. Note that this feature does periodic (default: three seconds) RPC with Kafka brokers to obtain lag information and should be enabled only if you intend to configure tolerable inconsistency for pull queries, as explained below.
Configuring pull queries
To control the inconsistency per pull query, you can specify ksql.query.pull.max.allowed.offset.lag. For instance, a value of 10,000 means that results of pull queries forwarded to servers whose current offset is more than 10,000 positions behind the end offset of the changelog topic will be rejected. Because the lag information is fetched only every few seconds, we recommend using this configuration only for coarse-grained, minute-level lag filtering. For example, if your table typically received 1,000 updates each minute, this configuration can be set to 10,000 to bound inconsistency between pull queries to 10 minutes.
Here is an example of a pull query issued via the REST API that limits the inconsistency to 10,000:
curl -X POST $KSQL_ENDPOINT/query \
       -H "Content-Type: application/vnd.ksql.v1+json; charset=utf-8" \
       -u $KSQL_BASIC_AUTH_USER_INFO \
       -d @<(cat <<EOF
{
  "ksql": "SELECT * FROM orders WHERE ROWKEY = ‘order-1’;",
  "streamsProperties": {"ksql.query.pull.max.allowed.offset.lag": "10000"}
}
EOF
)
If none of the servers can return results that honor the above limit, the above pull query would fail and display this message:
Unable to execute pull query SELECT * FROM orders WHERE ROWKEY = ‘order-1’;. All nodes are dead or exceed max allowed lag.
Monitoring and troubleshooting tools are indispensable for successfully operating distributed systems at scale. To that end, we also provide all of the internal state the servers use to route the pull queries neatly packaged into a single REST endpoint. You can easily check the status of servers in the cluster as well as their end and current offsets per partition by issuing:
curl -sX GET "$KSQL_ENDPOINT/clusterStatus"
For our running example, this would return the following excerpt:
{
  "clusterStatus": {
      "B:8088": { 1
          "hostAlive": false,
          "lastStatusUpdateMs": 1585257664632,
          "activeStandbyPerQuery": {},
          "hostStoreLags": {}
      },
      "C:8088": { 2
          "hostAlive": true,
          "lastStatusUpdateMs": 1585257664632,
          "activeStandbyPerQuery": {
            "CTAS_ORDERS": {
              "activePartitions": ["topic": "<changelog_topic_name>",  "partition": 0 ],
              "standByPartitions": ["topic": "<changelog_topic_name>", "partition": 2]
            },
          },
          "stateStoreLags": {
              "lagByPartition": {
                  "0": {"currentOffsetPosition": 123000,"endOffsetPosition": 123000, "offsetLag": 0},
                  "2": {"currentOffsetPosition": 100000, "endOffsetPosition": 107000,"offsetLag": 7000}
              },
              "updateTimeMs": 1585257660931
          }
      }
  }
}
1Server B is dead.
2Server C is the active for partition 0 and standby for partition 2, which is 7,000 offsets behind.
What’s next?
Although we have made some great strides here, there are many more exciting improvements ahead. We would like to underscore a few of them, so you know what to expect.
Lag-aware reassignment: In the near future, we will improve the algorithm that elects a new server during failure recovery to choose the one that is most likely to catch up quickly, thus reducing the window of unavailability of ksqlDB servers even more. See KIP-441 for more details.
Bounding replication lag: Although standby replication is quick in practice, severe network partitioning can cause a standby to lag in an unbounded manner and thus increase the unavailability for use cases that cannot give up consistency. We are looking into ways to bound the amount of drift between different servers hosting the same table partitions.
Intuitive expression of maximum lag: Although the current approach lets you specify tolerable staleness in terms of number of messages under failure scenarios, it does not correlate to the source event streams in any way. We are exploring ways of introducing a level of expressibility into pull queries.
Repeatable results: Sometimes a user may want to ensure that successive pull queries on the same rowkey return only the same or newer values (but never older). To enable this, we can return positional information (e.g., position in the changelog topic corresponding to the table’s state) in each query result that can be sent along in a future query. ksqlDB can then wait until the underlying replication catches up to the same position before executing the pull query, guaranteeing repeatable results.
To learn more about interactive queries in Kafka Streams, check out this podcast and the blog post Kafka Streams Interactive Queries Go Prime Time.
If you’d like to stay connected and learn more about what’s to come in ksqlDB, we welcome you to join the #ksqldb Confluent Community Slack channel!
Avez-vous aimé cet article de blog ? Partagez-le !
Abonnez-vous au blog Confluent
Stop Treating Your LLM Like a Database
GenAI thrives on real-time contextual data: In a modern system, LLMs should be designed to engage, synthesize, and contribute, rather than to simply serve as queryable data stores.
Generative AI Meets Data Streaming (Part III) – Scaling AI in Real Time: Data Streaming and Event-Driven Architecture
In this final part of the blog series, we bring it all together by exploring data streaming platforms (DSPs), event-driven architecture (EDA), and real-time data processing to scale AI-powered solutions across your organization.

