[Webinar] AI-Powered Innovation with Confluent & Microsoft Azure | Register Now
We ❤️ syslogs: Real-time syslog Processing with Apache Kafka and KSQL – Part 1: Filtering
Syslog is one of those ubiquitous standards on which much of modern computing runs. Built into operating systems such as Linux, it’s also commonplace in networking and IoT devices like IP cameras. It provides a way for streaming log messages, along with metadata such as the source host, severity of the message, and so on. Sometimes the target is simply a local logfile, but more often it’s a centralized syslog server which in turn may log or process the messages further.
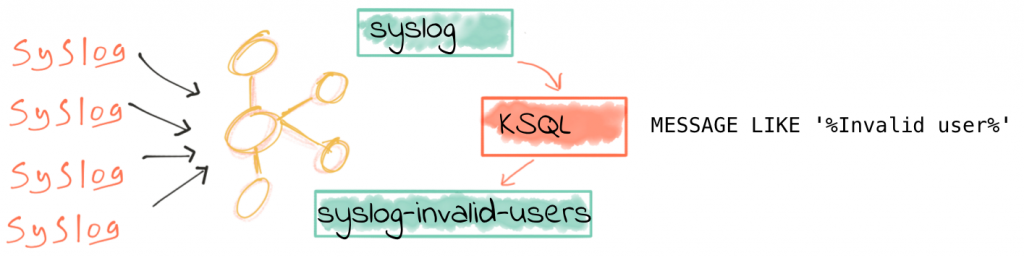
As a high-performance, distributed streaming platform, Apache Kafka® is a great tool for centralized ingestion of syslog data. Since Apache Kafka also persists data and supports native stream processing we don’t need to land it elsewhere before we can utilize the data. You can stream syslog data into Kafka in a variety of ways, including through Kafka Connect for which there is a dedicated syslog plugin.
In this post, we’re going to see how KSQL can be used to process syslog messages as they arrive in real time. KSQL is the SQL streaming engine for Apache Kafka. Using just SQL, executing interactively or as a deployed application, we can filter, enrich and aggregate streams of data in Kafka. Processed data from KSQL goes back onto Kafka, meaning that we can easily filter and cleanse data arriving in Kafka for use up-stream in multiple applications requiring the same data.
Filter syslog data with KSQL
Getting started with syslog and stream processing in KSQL is simple. First of all, download and install Confluent Platform. You’ll also need to install and configure the syslog plugin for Kafka Connect, and then configure your syslog sources to send their data to it. How you do this depends on your syslog client implementation—for syslog, see here.
Assuming you’re using the syslog topic for your inbound data, we can start by simply inspecting the data on the topic, from the KSQL prompt (run ksql local to launch):
ksql> PRINT 'syslog' FROM BEGINNING;
Format:AVRO
11/9/18 2:56:02 PM UTC, proxmox01, {"name": null, "type": "RFC3164", "message": "I ❤️ logs", "host": "proxmox01", "version": null, "level": 5, "tag": "rmoff", "extension": null, "severity": null, "appName": null, "facility": 1, "remoteAddress": "192.168.10.250", "rawMessage": "<13>Nov  9 14:56:02 proxmox01 rmoff: I ❤️ logs", "processId": null, "messageId": null, "structuredData": null, "deviceVendor": null, "deviceProduct": null, "deviceVersion": null, "deviceEventClassId": null, "date": 1541775362000}
If you leave this running you’ll see all new events streaming to the console. Press Ctrl-C to return to the KSQL prompt.
We can now declare a KSQL stream over the topic, using the format detected:
ksql> CREATE STREAM SYSLOG WITH (KAFKA_TOPIC='syslog',VALUE_FORMAT='AVRO');Message ---------------- Stream created ----------------
Using standard SQL commands, we can query and manipulate the stream of events.
ksql> SELECT HOST,MESSAGE FROM SYSLOG;
proxmox01.moffatt.me | I ❤  logs
proxmox01.moffatt.me | I still ❤  logs
This is a continuous query, and will continue to show new data as it arrives. Press Ctrl-C to cancel and return to the KSQL prompt.
Apache Kafka persists data, so not only can KSQL show current and future inbound messages—we can also query the past! To do this we’ll instruct KSQL to process messages from the beginning of the topic:
ksql> SET 'auto.offset.reset' = 'earliest';
Successfully changed local property 'auto.offset.reset' from 'null' to 'earliest'
Now when you re-run the same SELECT statement as above, you see the full contents of the syslog topic:
ksql> SELECT HOST,MESSAGE FROM SYSLOG;
localhost | X
localhost | foo I love logs
localhost | I ❤  logs
proxmox01.moffatt.me | I ❤  logs
proxmox01.moffatt.me | I still ❤  logs
I’m going to cut over to some real syslog data now, so that we can explore the potential of what we can do with KSQL. My syslog data is streamed from my home network—a few servers and containers, some network APs, and a bunch of mobile devices.
ksql> SELECT TIMESTAMPTOSTRING(DATE, 'yyyy-MM-dd HH:mm:ss') AS SYSLOG_TS, HOST, MESSAGE FROM SYSLOG;
2018-03-12 13:30:59 | rpi-03 | rpi-03 sshd[30105]: Invalid user oracle from 185.55.218.153
2018-03-12 13:30:59 | rpi-03 | rpi-03 sshd[30105]: input_userauth_request: invalid user oracle [preauth]
2018-03-12 13:30:59 | rpi-03 | rpi-03 sshd[30105]: Received disconnect from 185.55.218.153: 11: Bye Bye [preauth]
2018-03-12 13:31:00 | rpi-03 | rpi-03 sshd[30109]: reverse mapping checking getaddrinfo for host3.artegix.info [185.55.218.153] failed - POSSIBLE BREAK-IN ATTEMPT!
2018-03-12 13:31:01 | rpi-03 | rpi-03 sshd[30117]: Invalid user test from 185.55.218.153
2018-03-12 13:31:01 | rpi-03 | rpi-03 sshd[30117]: input_userauth_request: invalid user test [preauth]
2018-03-12 13:31:01 | rpi-03 | rpi-03 sshd[30117]: Received disconnect from 185.55.218.153: 11: Bye Bye [preauth]
2018-03-12 13:31:02 | rpi-03 | rpi-03 sshd[30121]: reverse mapping checking getaddrinfo for host3.artegix.info [185.55.218.153] failed - POSSIBLE BREAK-IN ATTEMPT!
2018-03-12 13:31:02 | rpi-03 | rpi-03 sshd[30121]: Invalid user test from 185.55.218.153
2018-03-12 13:31:05 | ("BZ2,24a43c000000,v3.7.40.6115") | ("BZ2,24a43c000000,v3.7.40.6115") syslog: dpi.dpi_stainfo_notify(): dpi not enable
2018-03-12 13:31:05 | ("BZ2,24a43c000000,v3.7.40.6115") | ("BZ2,24a43c000000,v3.7.40.6115") hostapd: ath1: STA xx:xx:xx:xx:xx:xx IEEE 802.11: associated
2018-03-12 13:31:06 | ("U7PG2,f09fc2000000,v3.7.40.6115") | ("U7PG2,f09fc2000000,v3.7.40.6115") hostapd: ath3: STA xx:xx:xx:xx:xx:xx IEEE 802.11: disassociated
2018-03-12 13:31:06 | ("U7PG2,f09fc2000000,v3.7.40.6115") | ("U7PG2,f09fc2000000,v3.7.40.6115") libubnt[9577]: dpi.dpi_stainfo_notify(): dpi not enable
2018-03-12 13:31:06 | ("U7PG2,f09fc2000000,v3.7.40.6115") | ("U7PG2,f09fc2000000,v3.7.40.6115") libubnt[9577]: wevent.ubnt_custom_event(): EVENT_STA_LEAVE ath3: xx:xx:xx:xx:xx:xx / 0
2018-03-12 13:31:06 | ("BZ2,24a43c000000,v3.7.40.6115") | ("BZ2,24a43c000000,v3.7.40.6115") hostapd: ath1: STA xx:xx:xx:xx:xx:xx RADIUS: starting accounting session 5A9BFF48-00000286
2018-03-12 13:31:06 | ("BZ2,24a43c000000,v3.7.40.6115") | ("BZ2,24a43c000000,v3.7.40.6115") hostapd: ath1: STA xx:xx:xx:xx:xx:xx WPA: pairwise key handshake completed (RSN)
2018-03-12 13:31:06 | ("BZ2,24a43c000000,v3.7.40.6115") | ("BZ2,24a43c000000,v3.7.40.6115") syslog: wevent.ubnt_custom_event(): EVENT_STA_JOIN ath1: xx:xx:xx:xx:xx:xx / 4
2018-03-12 13:33:35 | proxmox01 | proxmox01 kernel: [30936072.607801] audit: type=1400 audit(1520861615.501:3062182): apparmor="DENIED" operation="ptrace" profile="docker-default" pid=26854 comm="node" requested_mask="trace" denied_mask="trace" peer="docker-default"
2018-03-12 13:33:38 | proxmox01 | proxmox01 kernel: [30936075.188047] audit: type=1400 audit(1520861618.081:3062183): apparmor="DENIED" operation="ptrace" profile="docker-default" pid=26854 comm="node" requested_mask="trace" denied_mask="trace" peer="docker-default"----
This is just a small sample of what’s in there, but we can spot a few things going on:
- Login attacks against one of my public-facing servers
- Wifi access point client connections/disconnections
- Linux security module action logs
We’re going to see now how we can extract just certain logs of interest—in this case, the login attacks.
| Note |
We’re deliberately not going to try and do this closer to the originator (e.g. by changing the syslog config on the source) because this ‘premature optimisation’ of our data reduces its overall fidelity and prevents us doing other work with it. For example: we still want to retain all our syslog data for long-term storage—perhaps for audit purposes, perhaps for purposes we don’t even know yet—and if we cut down the scope of the data too early we can’t do this. |
To filter out our syslog data (both that already on the topic, that arriving now, and all that arrives in the future), we just use a SQL predicate clause:
ksql> SELECT TIMESTAMPTOSTRING(DATE, 'yyyy-MM-dd HH:mm:ss') AS SYSLOG_TS, HOST, MESSAGE \
FROM SYSLOG \
WHERE HOST='rpi-03' AND MESSAGE LIKE '%Invalid user%'\
LIMIT 5;
2018-03-04 15:14:24 | rpi-03 | rpi-03 sshd[24150]: Invalid user mini from 114.130.4.16
2018-03-04 15:21:49 | rpi-03 | rpi-03 sshd[24200]: Invalid user admin from 103.99.0.209
2018-03-04 15:21:58 | rpi-03 | rpi-03 sshd[24204]: Invalid user support from 103.99.0.209
2018-03-04 15:22:06 | rpi-03 | rpi-03 sshd[24208]: Invalid user user from 103.99.0.209
2018-03-04 15:22:23 | rpi-03 | rpi-03 sshd[24216]: Invalid user 1234 from 103.99.0.209
LIMIT reached for the partition.
Query terminated
(Note I’m using the \ line continuation character, to make the statement more readable. You can enter it all on a single line if you’d like)
This is pretty useful for being able to quickly interrogate and inspect the logs. But let’s see something even more useful! We can persist this data, into a stream which holds not only the past logs filtered, but also every new log that is received. To do this, you just add the CREATE STREAM foo AS (often referred to as CSAS) to the front of your query:
ksql> CREATE STREAM SYSLOG_INVALID_USERS AS \
SELECT * \
FROM SYSLOG \
WHERE HOST='rpi-03' AND MESSAGE LIKE '%Invalid user%';
Message
----------------------------
Stream created and running
----------------------------
We’ve created a derived stream, which can be queried just as any other object in KSQL:
ksql> SELECT * FROM  SYSLOG_INVALID_USERS LIMIT 1;
1520176464386 | //192.168.10.105:38254 | 1520176464000 | 4 | rpi-03 | 6 | rpi-03 sshd[24150]: Invalid user mini from 114.130.4.16 | UTF-8 | /192.168.10.105:38254 | rpi-03.moffatt.me
LIMIT reached for the partition.
Query terminated
Under the covers, KSQL has actually created a Kafka topic and is populating this topic in real-time with any messages that match the criteria that we’ve defined against the source topic. We can see the new topic, and the messages in it—it’s just a Kafka topic:
$ kafka-topics --zookeeper localhost:2181 --list|grep SYSLOG
SYSLOG_INVALID_USERS
$
$ kafka-avro-console-consumer \
 --bootstrap-server proxmox01.moffatt.me:9092 \
 --property schema.registry.url=http://proxmox01.moffatt.me:8081 \
 --topic SYSLOG_INVALID_USERS --max-messages=1 --from-beginning|jq '.'
 {
  "NAME": null,
  "TYPE": {
    "string": "RFC3164"
  },
  "MESSAGE": {
    "string": "Invalid user xbmc from 186.249.209.22"
  },
  "HOST": {
    "string": "rpi-03"
  },
  "VERSION": null,
  "LEVEL": {
    "int": 6
  },
  "TAG": {
    "string": "sshd"
  },
  "EXTENSION": null,
  "SEVERITY": null,
  "APPNAME": null,
  "FACILITY": {
    "int": 4
  },
  "REMOTEADDRESS": {
    "string": "192.168.10.105"
  },
  "RAWMESSAGE": {
    "string": "<38>Nov  9 14:23:19 rpi-03 sshd[4846]: Invalid user xbmc from 186.249.209.22"
  },
  "PROCESSID": {
    "string": "4846"
  },
  "MESSAGEID": null,
  "STRUCTUREDDATA": null,
  "DEVICEVENDOR": null,
  "DEVICEPRODUCT": null,
  "DEVICEVERSION": null,
  "DEVICEEVENTCLASSID": null,
  "DATE": {
    "long": 1541773399000
  }
}
Processed a total of 1 messages
To track the throughput of the new stream, as well as see more details such as the underlying topic name, columns, etc use the DESCRIBE EXTENDED command:
ksql> DESCRIBE EXTENDED SYSLOG_INVALID_USERS;
Name                 : SYSLOG_INVALID_USERS
Type                 : STREAM
Key field            :
Key format           : STRING
Timestamp field      : Not set - using
Value format         : AVRO
Kafka topic          : SYSLOG_INVALID_USERS (partitions: 4, replication: 1)
Field              | Type
ROWTIME            | BIGINT           (system)
ROWKEY             | VARCHAR(STRING)  (system)
NAME               | VARCHAR(STRING)
TYPE               | VARCHAR(STRING)
MESSAGE            | VARCHAR(STRING)
HOST               | VARCHAR(STRING)
VERSION            | INTEGER
LEVEL              | INTEGER
TAG                | VARCHAR(STRING)
EXTENSION          | MAP<STRING, VARCHAR(STRING)>
SEVERITY           | VARCHAR(STRING)
APPNAME            | VARCHAR(STRING)
FACILITY           | INTEGER
REMOTEADDRESS      | VARCHAR(STRING)
RAWMESSAGE         | VARCHAR(STRING)
PROCESSID          | VARCHAR(STRING)
MESSAGEID          | VARCHAR(STRING)
STRUCTUREDDATA     | ARRAY<STRUCT>>
DEVICEVENDOR       | VARCHAR(STRING)
DEVICEPRODUCT      | VARCHAR(STRING)
DEVICEVERSION      | VARCHAR(STRING)
DEVICEEVENTCLASSID | VARCHAR(STRING)
DATE               | BIGINT
Queries that write into this STREAM
CSAS_SYSLOG_INVALID_USERS_25 : CREATE STREAM SYSLOG_INVALID_USERS AS SELECT * FROM SYSLOG WHERE HOST='rpi-03' AND MESSAGE LIKE '%Invalid user%';
For query topology and execution plan please run: EXPLAIN
Local runtime statistics
messages-per-sec:      0.04   total-messages:         4     last-message: 11/9/18 3:00:29 PM UTC
failed-messages:         0 failed-messages-per-sec:         0      last-failed:       n/a
(Statistics of the local KSQL server interaction with the Kafka topic SYSLOG_INVALID_USERS)
Summary & What’s Next…
KSQL gives anyone the power to write stream processing applications, using the simple declarative language of SQL. In this article we’ve seen how we can inspect inbound streams of syslog data and easily create a live stream of filtered messages written to a second Kafka topic.
In the next article we’ll take a brief detour from KSQL itself, and look at using Python to write a very simple push-notification system, driven by events arriving in a Kafka topic. We’ll see some simple anomaly detection, building on KSQL’s stateful aggregation capabilities.
After that we’ll return to KSQL in force, using its superpowers to join our inbound syslog data with useful data from a datastore that we can use to enrich the syslog data in realtime.
To read more about building streaming data pipelines with Apache Kafka and KSQL, check out the following:
- KSQL in Action: Real-Time Streaming ETL from Oracle Transactional Data
- No More Silos: How to Integrate your Databases with Apache Kafka and CDC
- ksqlDB, the successor to KSQL, along with the latest syntax
Did you like this blog post? Share it now
Subscribe to the Confluent blog


Stop Treating Your LLM Like a Database
GenAI thrives on real-time contextual data: In a modern system, LLMs should be designed to engage, synthesize, and contribute, rather than to simply serve as queryable data stores.


Generative AI Meets Data Streaming (Part III) – Scaling AI in Real Time: Data Streaming and Event-Driven Architecture
In this final part of the blog series, we bring it all together by exploring data streaming platforms (DSPs), event-driven architecture (EDA), and real-time data processing to scale AI-powered solutions across your organization.