[Virtuelles Event] GenAI Streamposium: Lerne, Echtzeit-GenAI-Apps zu entwickeln und zu skalieren | Jetzt registrieren
Lessons Learned from Running Apache Kafka at Scale at Pinterest
Apache Kafka® is at the heart of the data transportation layer at Pinterest. The amount of data that runs through Kafka has constantly grown over the years. This growth sometimes brings operational challenges that we have to deal with and plan for to make sure data transportation runs as smoothly as possible. This article shares how we run Kafka at Pinterest and discusses some of the challenges we’ve faced and how we’ve addressed them.
What is Pinterest?
Pinterest is a visual discovery engine for finding ideas like recipes, home and style inspiration, and more. The user base and the use cases that attract users to the platform have dramatically increased over the years. As of December 2020, Pinterest attracts over 459 million monthly active users and hosts 300 billion pins and 6.7+ billion boards—and these numbers continue to grow. This growth has resulted in an ever-increasing amount of generated data that requires transportation from the source to various systems, real time and batch, for ingestion and processing.
Data transportation topology
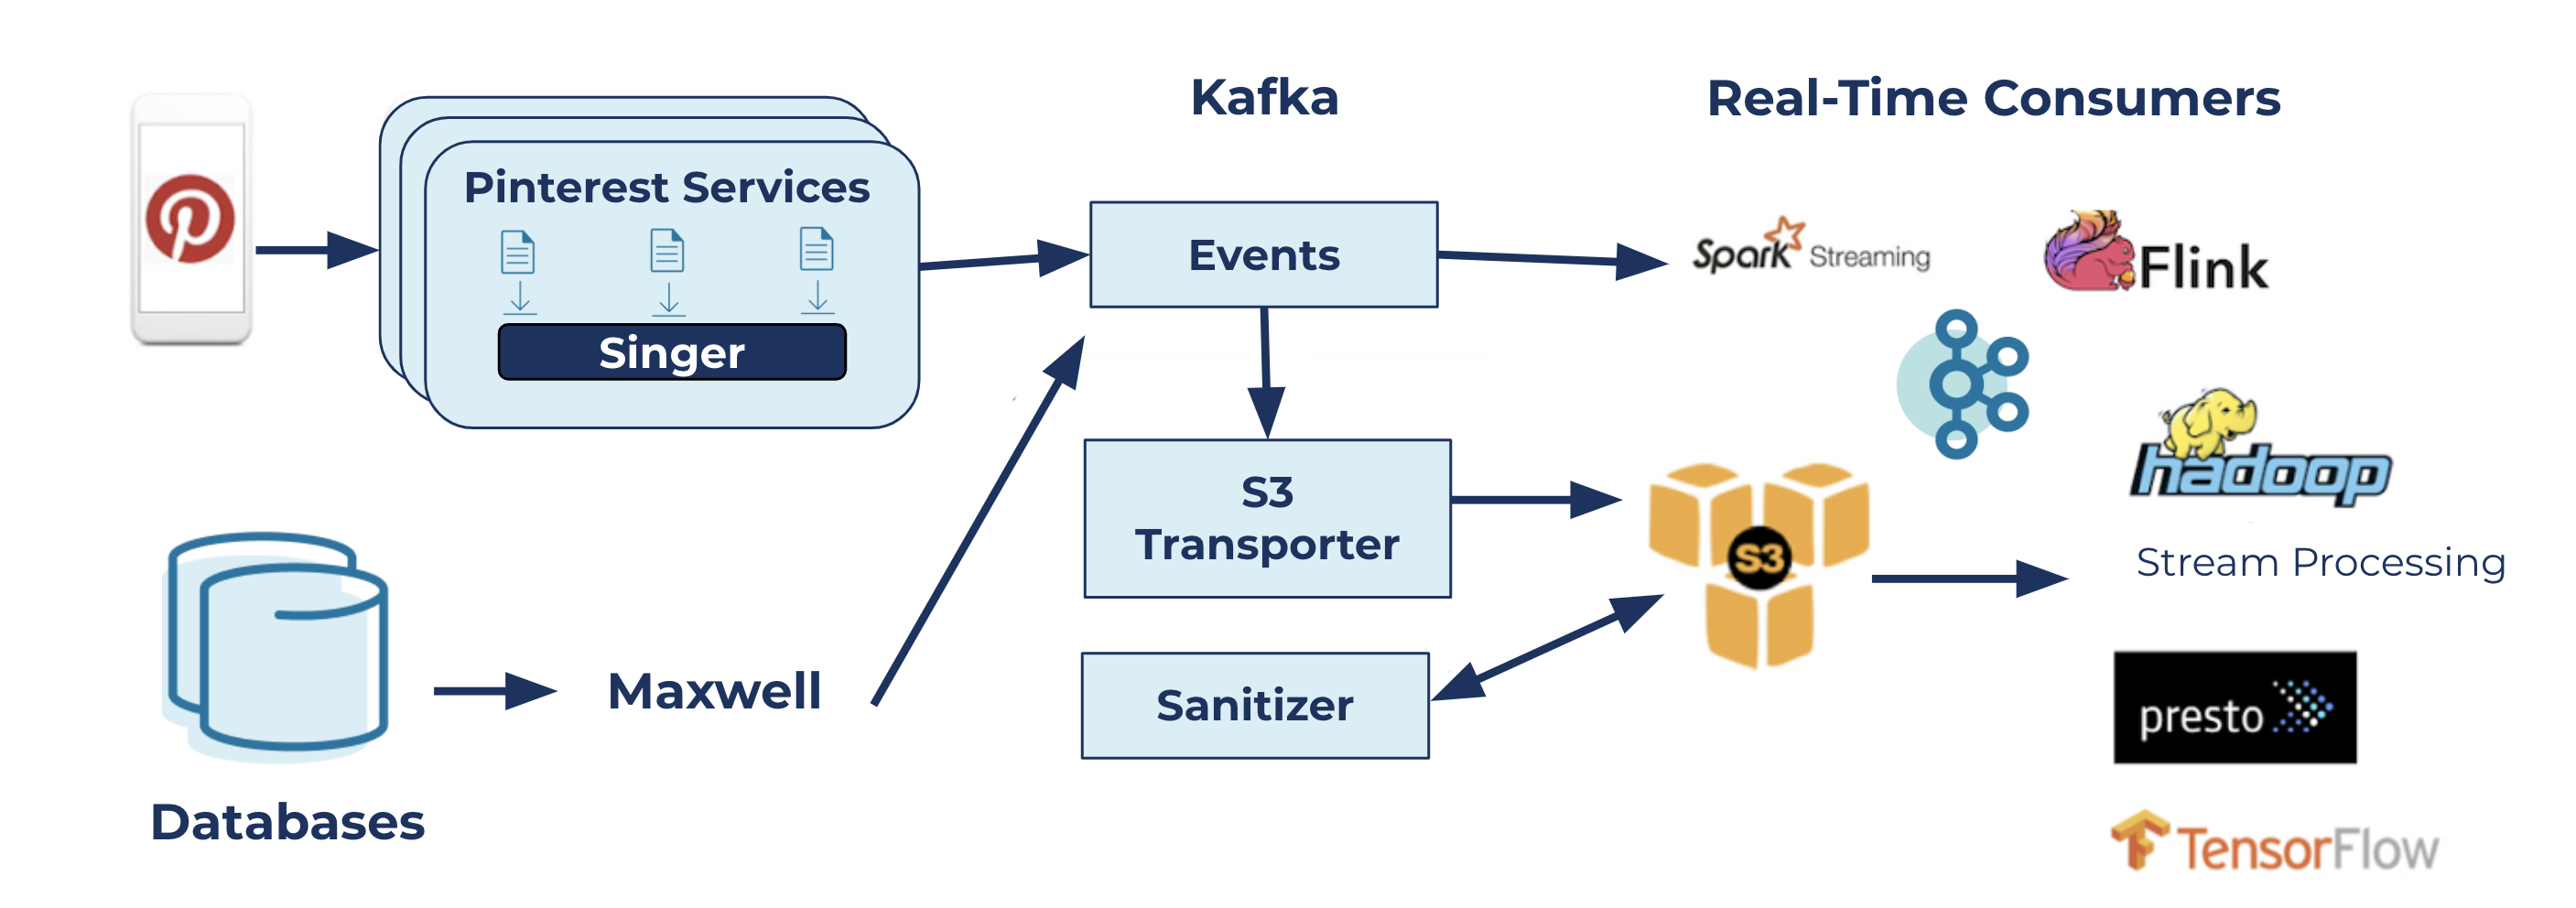
Pinterest’s data transportation topology
The diagram above illustrates how data moves at Pinterest. Events associated with user actions on the platform (mobile application or web) are logged in files. Singer, our highly performant and efficient logging agent, runs agents on hosts that are responsible for sending those logs to Kafka. The other path that flows messages to Kafka is the incremental database ingestion pipeline that is powered by Maxwell, which is responsible for sending database changelogs to Kafka for downstream use cases.
There are two types of use cases for messages in Kafka clusters:
- Batch use cases: Our internal Amazon S3 Transporter service reads Kafka messages and writes them to S3. These offline logs are then used by various data jobs for analytical processing, machine learning, and more.
- Real-time use cases: There are many applications, such as native Kafka clients, Kafka Streams, Flink, and Spark streaming, which are consumers of a subset of Kafka topics that build several real-time pipelines. These include but are not limited to monetization, safety and spam detection, metrics processing, and experimentation use cases.
The Logging Platform team manages the topology components, from Singer to S3 Transporter and Sanitizer, and provides the necessary interfaces to its clients to make use of the service. More on this is covered in the automation section below. The diagram also shows the critical role that Kafka plays in this topology: a centerpiece that glues all of the other components together.
The Logging Platform runs and manages Kafka on Amazon EC2 virtual machines across multiple regions. The number of production clusters is over 50 and continues to grow over time. Clusters are classified based on domains, use case families, and impact radius.
As of December 2020, these 50+ clusters host 3,000+ brokers, 3,000+ topics, and ~500K partitions (including replicas). The inbound and outbound traffic peaks at ~25 GB/s and 50 GB/s, respectively (inbound messages peak at over 40 million/s). All clusters run Kafka version 2.3.1 with some cherry-picked commits.
Challenges and lessons learned
As Pinterest grows and onboards more and more users, so does the amount of data that needs to be transported from producers or logs to downstream services. This means that our services need to handle organic growth as well as use case growth, which has presented several challenges for the Logging Platform over time. This section briefly goes over these challenges and explains how we addressed them.
Performance issues
Magnetic disks
The hardware that a virtual machine (VM) runs on does not last forever and eventually has to be recycled. The Kafka broker that runs on the VM also goes out of service and needs to start fresh on another VM, replicating all the data it had before the host went down. Given the number of brokers that we manage, each week, a few brokers will go through the recovery stage. There are also maintenance operations, such as broker upgrades, OS upgrades, and rolling restarts, which require partial or full replays of logs for in-sync replica (ISR) restoration.
We used to run Kafka brokers on D2 instance types with magnetic disks. We also used to perform partition reassignments by moving partitions out of the broker that was going to be replaced and waiting for its full recovery. In this situation, the replaced broker has to perform disk I/O operations at a much-higher-than-usual rate. Because classic magnetic disks have limited IOPS during high load times (specifically during recovery), the queue depth for IOPS increases, causing increased latency, which triggers a cascading effect across topics and an entire cluster. For example, if the replaced broker, b1, has to fetch several partitions from the same leader broker, b2, it impacts the network bandwidth of b2, causing it to drop from the ISRs of the partitions that it is following. This chain reaction quickly brings several partitions down to a single ISR.
We looked for ways to improve the broker recovery process and reduce its impact on the whole cluster. After performing a root cause analysis of this issue, we discovered that the CPU I/O wait times of brokers spiked during these degraded states. Upon further investigation, we were able to attribute this observation to the density of Kafka brokers, that is, the number of partitions on the broker, the load on each partition, and the spike in fetches during broker recovery.
The answer was clear: Magnetic drives were simply not good enough to sustain our environment and did not meet our latency and operations requirements. We switched to SSDs because they provide a few orders of magnitude higher IOPS, giving brokers the burst capacity needed for recovery and load spikes and allowing us to operate at even higher broker densities. This has brought our CPU I/O wait time down from 10–30% (during degraded state) to < 0.1% (p100), resolving the degraded state issue and providing nearly uninterrupted service even while under-replicated partitions (URPs) are being recovered.
In addition to fixing our operations issues, SSDs provide consistent and predictable performance to our customers, irrespective of the fan-out ratios (number of consumers) and spikes in traffic (organic or otherwise).
Dynamic rebalancing
As mentioned in the previous section, we used to perform automated partition reassignments before each unhealthy broker replacement. This meant moving all partitions out of the unhealthy broker and temporarily assigning them to other brokers in the cluster and replacing the unhealthy node. Over time and after several incidents, we realized that the guarantee that this partition movement provides (a higher degree of availability for the partitions on the unhealthy broker for an average of about 30 minutes) was equal to the organic recovery of a Kafka broker.
As a result, we decided to disable the partition movement and let the unhealthy broker naturally recover after it is replaced. Instead, we transitioned to a static assignment model called brokersets. We’ve run this operation model for almost two years and have never regretted it.
Message format conversions
Our Kafka clusters used to run on different default log message format versions. Since most topics do not override these versions, significant tech debt organically piled up over time. This is primarily because upgrading the default log message format version of a cluster meant making sure that no existing (potentially old) client would break due to not being able to communicate with the brokers. This resulted in having clusters with an old default log message format version and a variety of clients (old and new) that used those clusters. Given that we had already invested in building a lineage system, it was simpler for us to track clients and pursue the system-wide upgrade initiative.
In general, whenever the format version of messages sent to Kafka or expected to be received from Kafka is different from the format version of messages stored by the broker, the broker may potentially have to convert those messages to match the client’s expectations. This conversion means additional CPU cycles on the broker side, which is amplified if the batch of messages is compressed because the CPU cost of decompression and recompression is added to the CPU cost of message format conversion.
As we explain further in the Kafka upgrade section below, having old clients upgrade to a more recent Kafka client library and upgrading the default log message format version of all clusters help us reduce unnecessary CPU load from the brokers and allow us to size Kafka clusters more efficiently and reduce costs.
Cost control
This section discusses some of the actions we took to reduce the overall cost of Kafka clusters. For a Kafka cluster, the costs include:
- Broker hosts: cost associated with EC2 instances
- Data transfer: cost associated with transferring data between EC2 instances
Rack-aware data transfer
With Kafka clusters and their clients hosted on EC2 instances, data transfer costs associated with the clusters include the following:
- Cost of receiving data from producers
- Cost of replicating data between brokers in each partition’s ISR set
- Cost of sending data to consumers
The majority of these costs occur when data is transferred in or out of an AWS region’s availability zone (AZ). For availability reasons, we keep ISRs in separate AZs; therefore, the cost associated with replicating data between brokers in each partition’s ISR set is the price that we pay for ensuring higher availability. For producers and consumers, however, we’ve implemented a rack-aware partitioner on the producer side (for Singer) and a rack-aware partition assignment strategy on the consumer side (for S3 Transporter) to alleviate a large percentage of the data transfer cost for moving data in and out of Kafka clusters. For more on this, please refer to this blog post: Optimizing Kafka for the Cloud.
Compression
Sending and storing uncompressed data in Kafka clusters leads to an increase in two types of AWS costs:
- Higher EC2 cost, as more disk space is required to keep the data in uncompressed format on Kafka brokers
- Higher data transfer costs because a larger number of bytes has to move between ISRs that are hosted in different AZs
By enforcing compression on the producer side, we lowered our infrastructure costs considerably on these fronts. This cost reduction outweighs the small increase of CPU load (< 10%) on the client side for having to deal with compressed messages.
We also use SinglePartitionPartitioner (the producer only writes to a single randomly selected partition) to improve compression ratios by up to two times since larger batches are leveraged.
Retention and replication factor
To further reduce the cost of Kafka clusters, we’ve implemented a few other improvements:
- We reduced the default retention of topics on the broker side and in our topic creation wizard. Customers who are not necessarily aware of the impact of retention on the cost would not unknowingly go with an unnecessarily long retention for the topics that they are creating.
- We reduced the default replication factor of dev and test clusters from three to two. This saved 33% of EC2 costs for those clusters and 50% of data transfer costs for replication as only one copy of data has to go from one AZ to another.
- On a case-by-case basis and upon approval of the topic owner, we also lowered the replication factor of some large production topics for which availability is less critical.
Placement and auto-balancing of partitions
Having to deal with scattered and randomly distributed partitions of each topic within the cluster used to be a recurring challenge for us (we used the default placement strategy provided by the new topic creation API). If there was an issue with a particular topic (e.g., the traffic suddenly spiked on the topic without prior notice), the issue could easily cascade to all other topics and the cluster as a whole because partition placements were not isolated for different topics.
To limit the blast radius in situations like this, we decided to enforce static partition assignments for each topic. We created the concept of brokersets, a logical subset of brokers in a Kafka cluster to which one or more topics can be assigned for placement. If a topic is assigned to a brokerset, the partitions of that topic will only be placed on the brokers contained in that set. For example, if a brokerset contains brokers 1 to 6 over three AZs (AZ1:1, 4; AZ2: 2, 5; AZ3: 3, 6), and a six-partition topic with replication factor of 3 assigned to it, all of those partitions (all replicas) will be placed on brokers 1 to 6.
We also defined the notion of strides, which determines how the actual partition assignment is calculated within a brokerset. They factor in AZ placement as well to make sure partition leaders are balanced across AZs. A stride of 0 means sequential placement, while higher strides add gaps in the sequence of replicas. For example, for the above brokerset 1–6 and the six-partition topic assigned to it, a stride of 0 and 1 lead to these partition assignments:
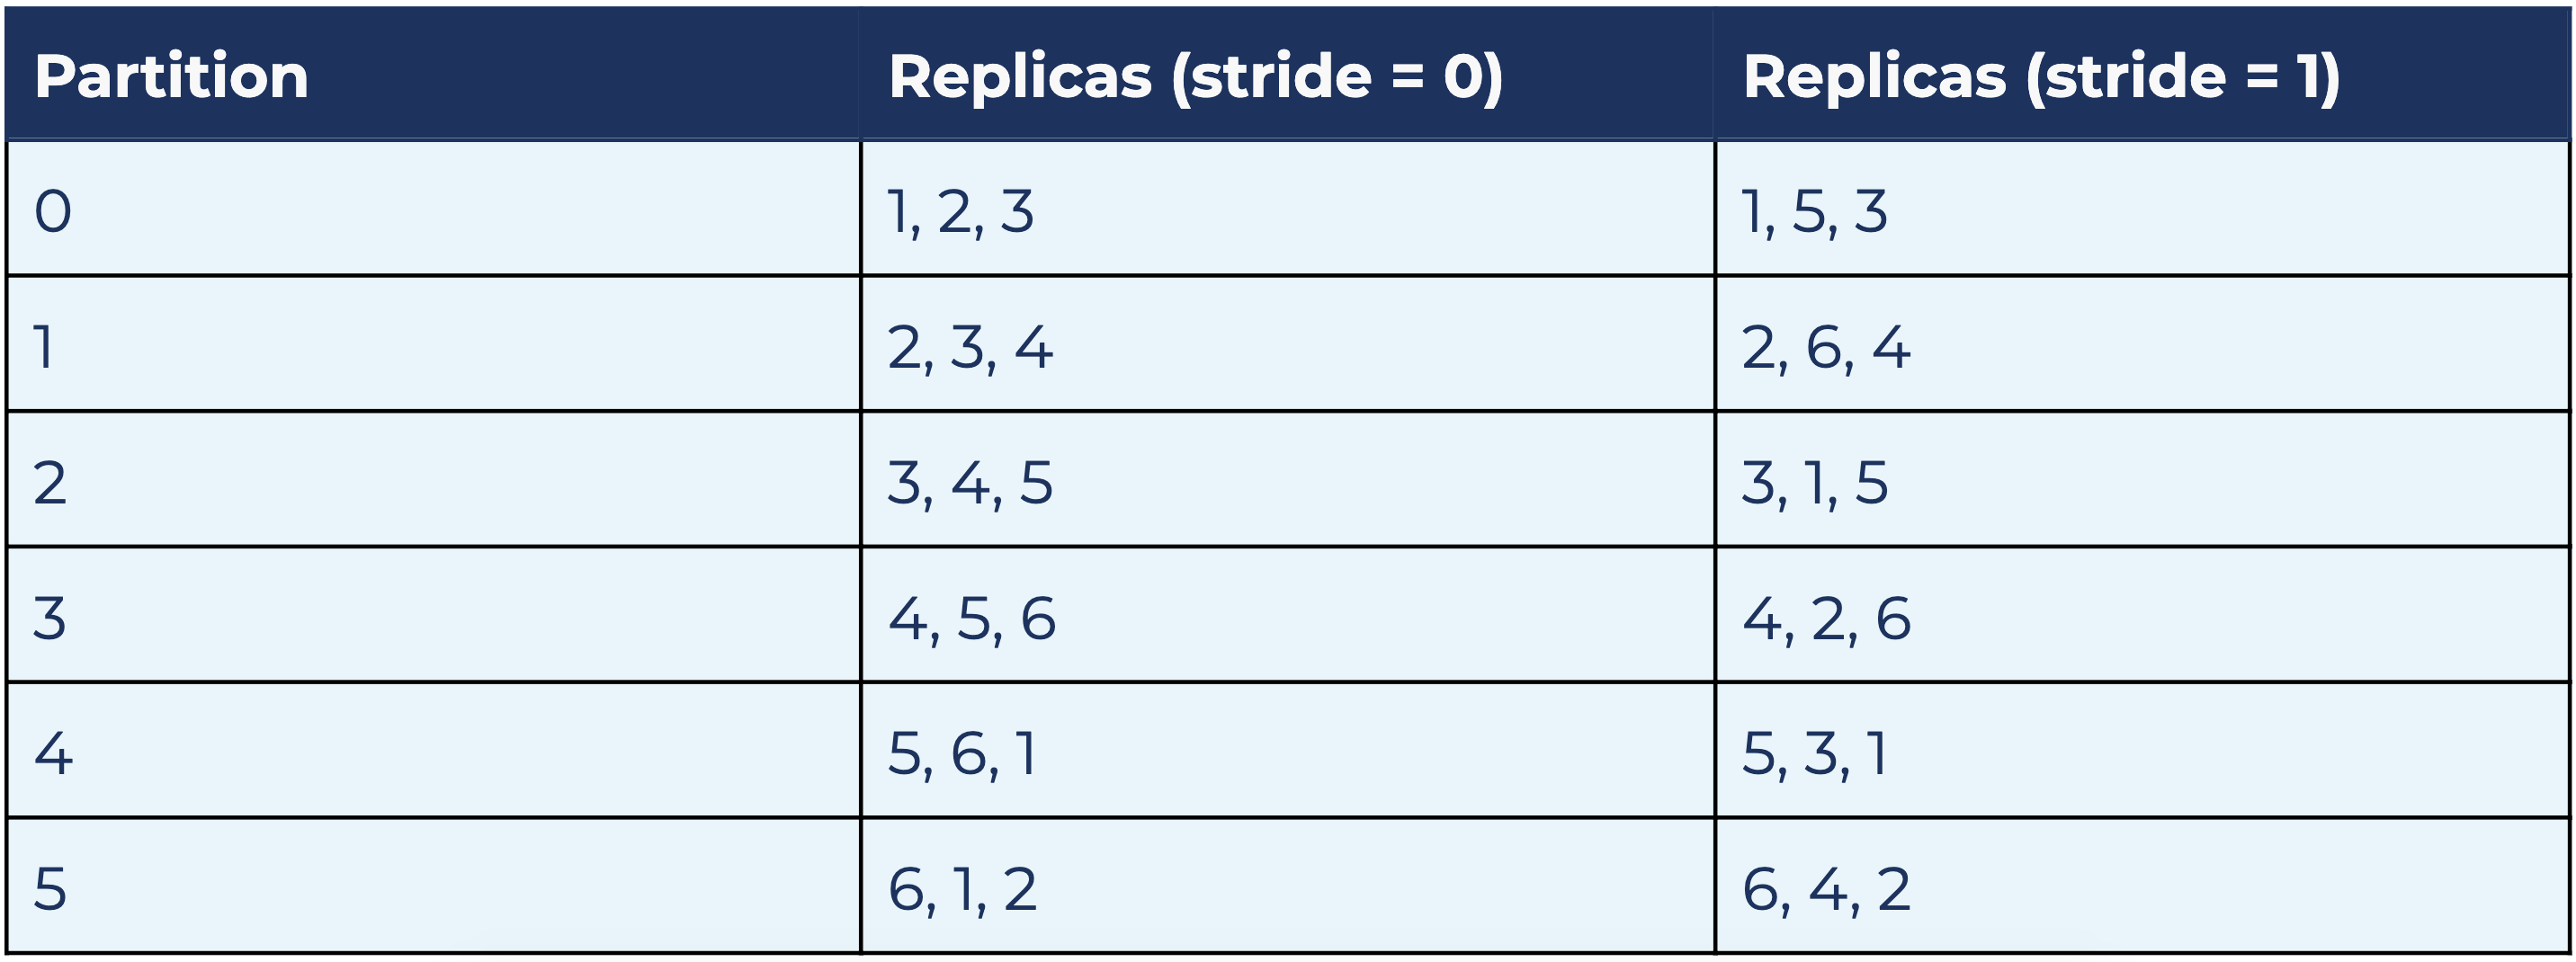
In both cases, each broker is the leader of one partition and a follower of two partitions. Each AZ is the leader of two partitions and follower of four partitions. Both strides 0 and 1 provide a balanced distribution.
The significance of strides comes into play when multiple topics are placed on the same brokerset. If all topics on the above brokerset use stride = 0, and, for example, broker 1 goes under maintenance or replacement, all leaders that were on 1 will temporarily move to broker 2. This doubles the load on broker 2 and could very well degrade that broker by saturating its resources (network bandwidth, CPU load, etc.). If topics use different stride values and one broker goes down, its load will be distributed among the other brokers in a balanced fashion (this actually depends on both the brokerset size and partition count), which means a single broker no longer has to carry all that extra load. Our partition assignment algorithm easily calculates the assignments based on these factors.
Brokersets simplify topic scaling too. If a topic’s throughput is expected to scale up or down and the existing brokerset is no longer a good fit, the topic can be easily assigned to another brokerset that is ready to handle the expected load. This leads to a one-time partition reassignment but merely changes the isolation of the topic from one brokerset to another.
If we ignore the Kafka cluster controller, brokersets provide virtual Kafka clusters within a Kafka cluster. Note that brokersets do not have to cover a single sequential list of broker IDs; multiple broker sequences can be used to build a brokerset, providing us the ability to minimize data movement during topic expansions. We also use brokersets to perform incremental capacity allocation on the cluster: we create a new brokerset when all the existing ones are completely utilized and also provide this awareness in our topic onboarding wizards to be load aware so that we can minimize operational churn for our team.
Brokerset-based topic management is available as a plugin in Orion (see the automation section for details).
Automation
We created a unified management layer called Orion to manage Kafka and other stateful distributed systems like HBase.
Until a year ago, both the Logging Platform team and our customers used Yahoo’s CMAK (formerly known as Kafka Manager) to get a view of the Kafka clusters, individual topics, and their configuration. We also used to rely on our earlier (now deprecated) open sourced auto-healing solution, DoctorK, for auto-recovery of brokers. There were inherent problems with these two systems:
- They were separate systems with no coherence between them
- Neither provided enough cluster controls to be able to perform cluster operations, such as broker upgrades, broker replacements, and brokerset support, automatically or semi-automatically
- Even though Pinterest open sourced DoctorK, the architecture was not easy to enhance and scale with new pluggable features
- DoctorK lacked cluster infrastructure operations capabilities
- Neither provided visibility for our customers when clusters were under maintenance
- We ran into frequent conflicts between automation and manual intervention
We implemented Orion as a generic solution for managing various stateful systems managed by our team. Orion, which we recently open sourced, is a unified solution that provides:
- Well-integrated alerting and automation features far beyond those of DoctorK
- A UI for cluster management that is more generic than CMAK
Pinterest uses Orion to manage all of its Kafka clusters and benefits from the following features:
- Cluster overview
- List of topics and their configuration, brokerset, disk usage, etc.
- List of brokersets and their configuration
- List of consumer groups and their configuration, coordinator, members, lags, etc.
- List of brokers, their AZ placement, instance type, number of topics and partitions, disk usage, etc.
- Cluster operations
- Replacing brokers
- Service stop/start/restart
- Upgrading brokers
- Putting brokers on maintenance mode (to disable all automation actions)
- Restarting broker hosts
- Decommissioning brokers
- Rolling restart of brokers (with optional parallelism when applicable)
- Automation services
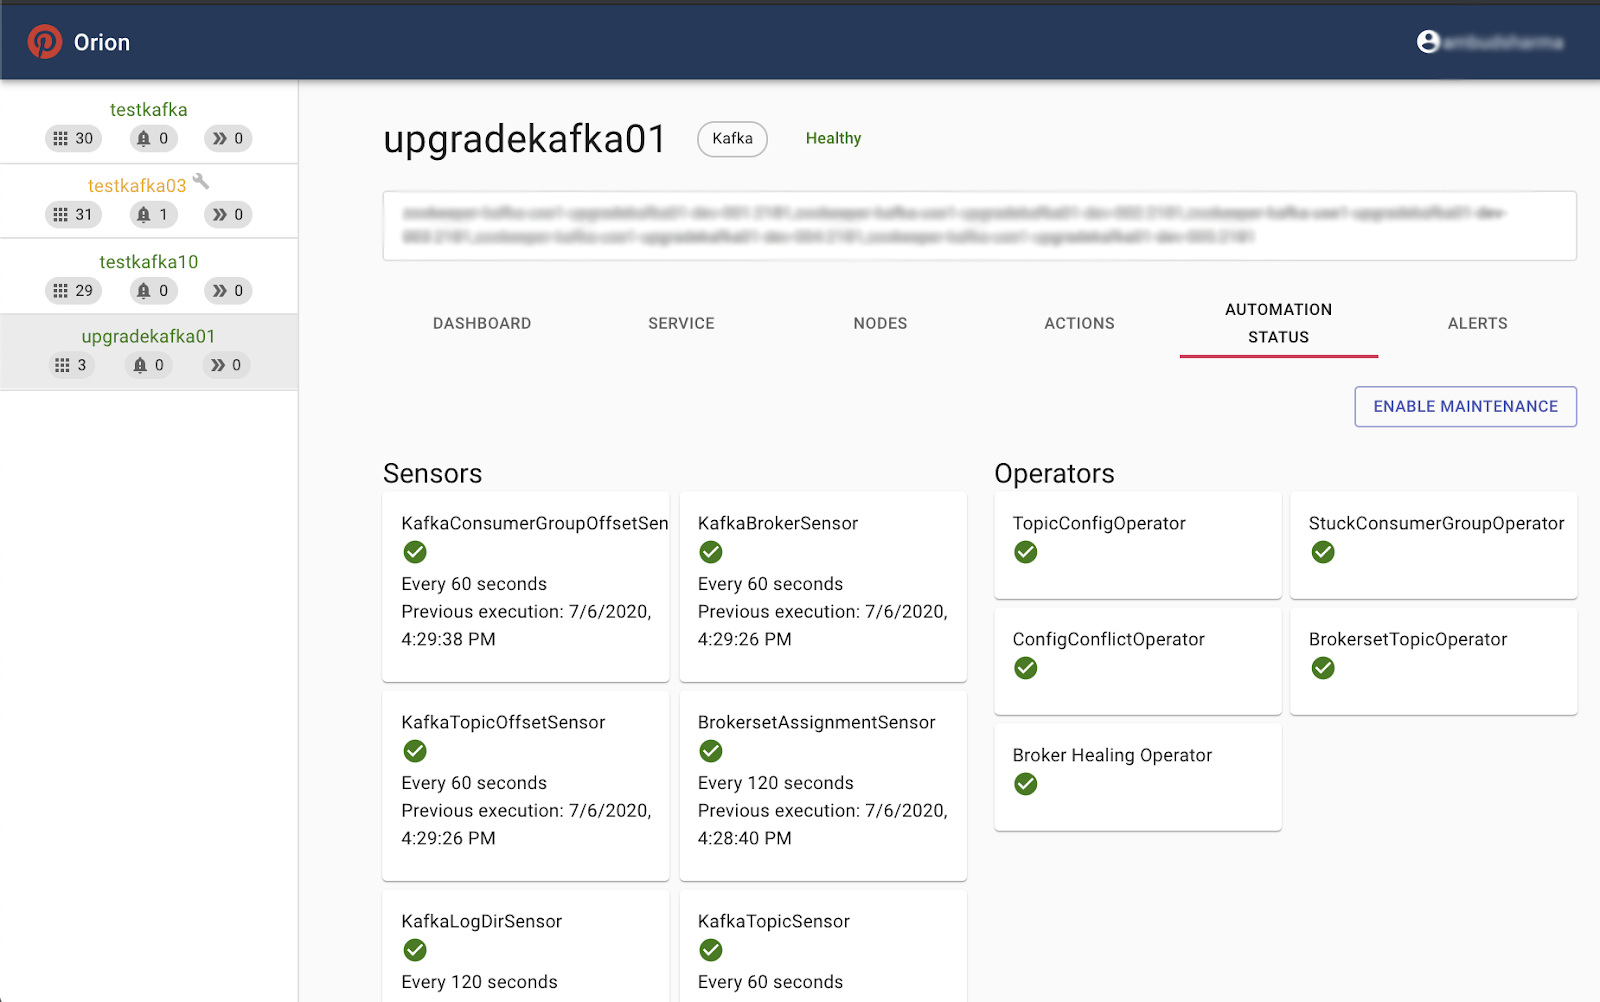
- Configurable active sensors: Examples include the consumer group offset sensor, topic offset sensor, brokerset assignment sensor, log directory sensor, topic sensor, broker sensor, and broker config sensor
- Configurable operators: Examples include the topic config operator, brokerset topic operator, config conflict operator, and broker healing operator
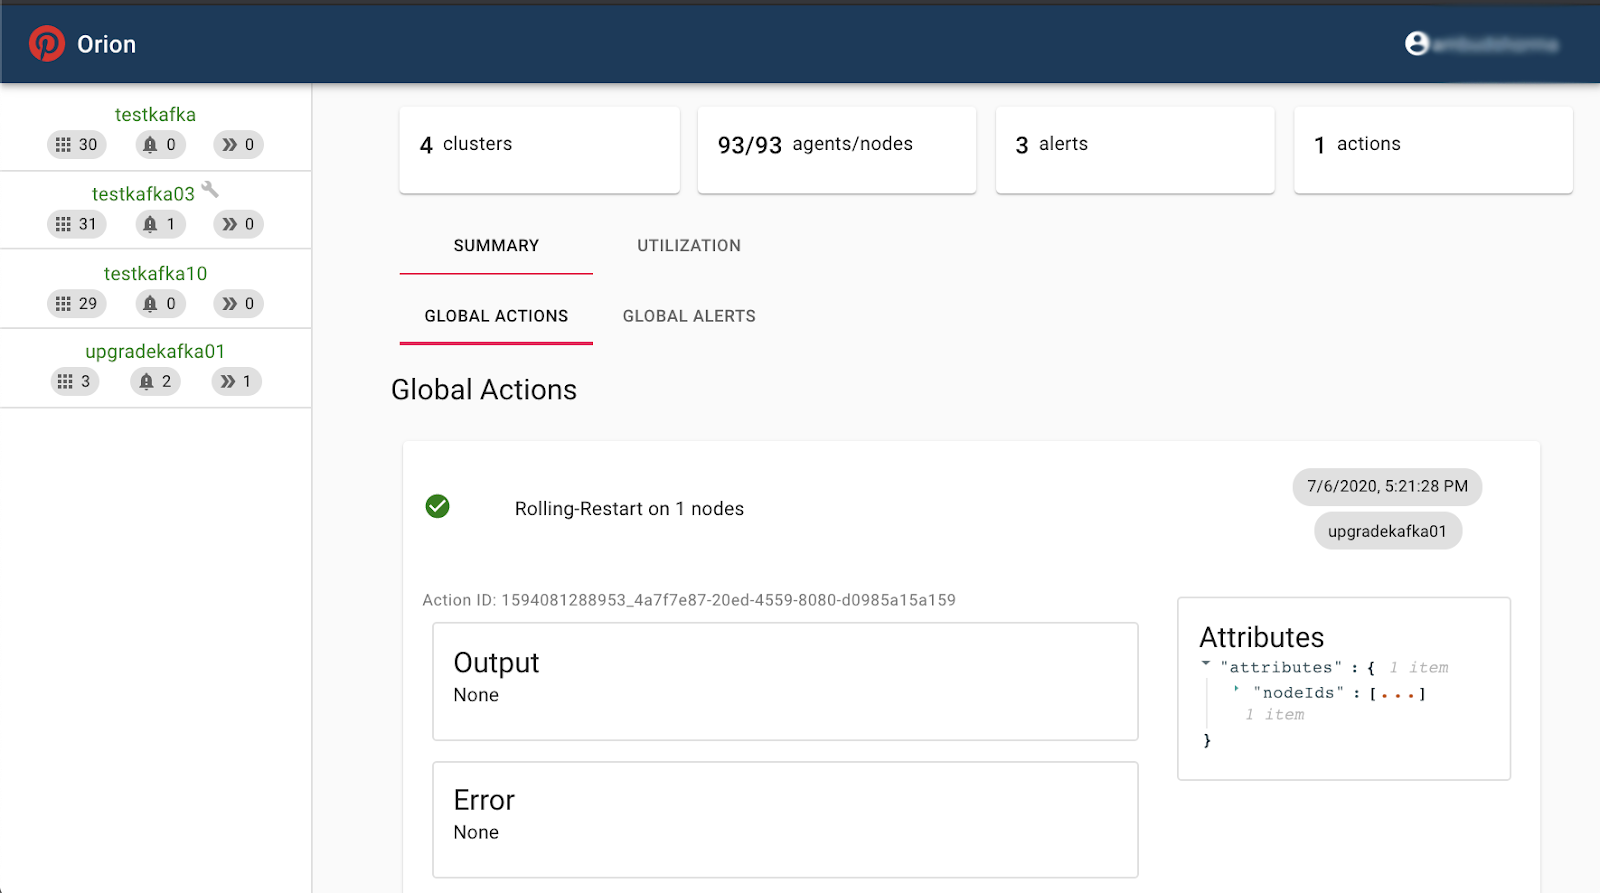
- Actions view
- Lists the history of actions performed on the cluster (e.g., brokers rolling restarts and broker auto recovery)
- Alerts view
- Lists any active alert on the cluster (e.g., under-replicated partitions and unhealthy broker)
The image below highlights screenshots of Orion in action. You can check out Orion on GitHub for more information.
 |
 |
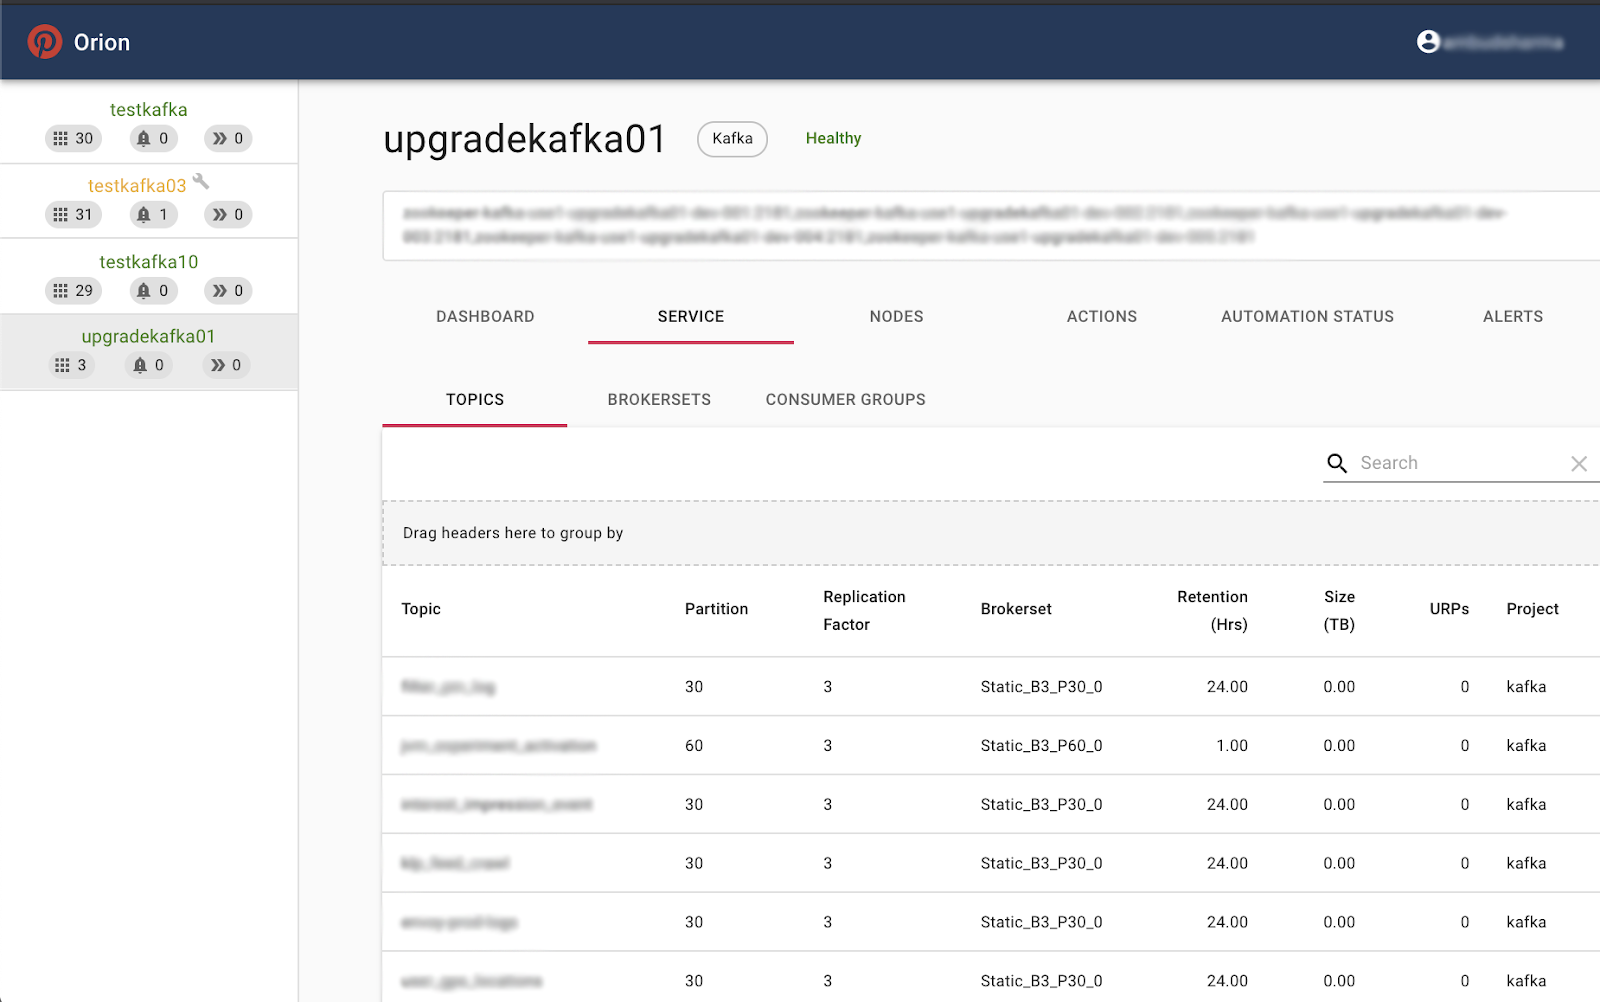 |
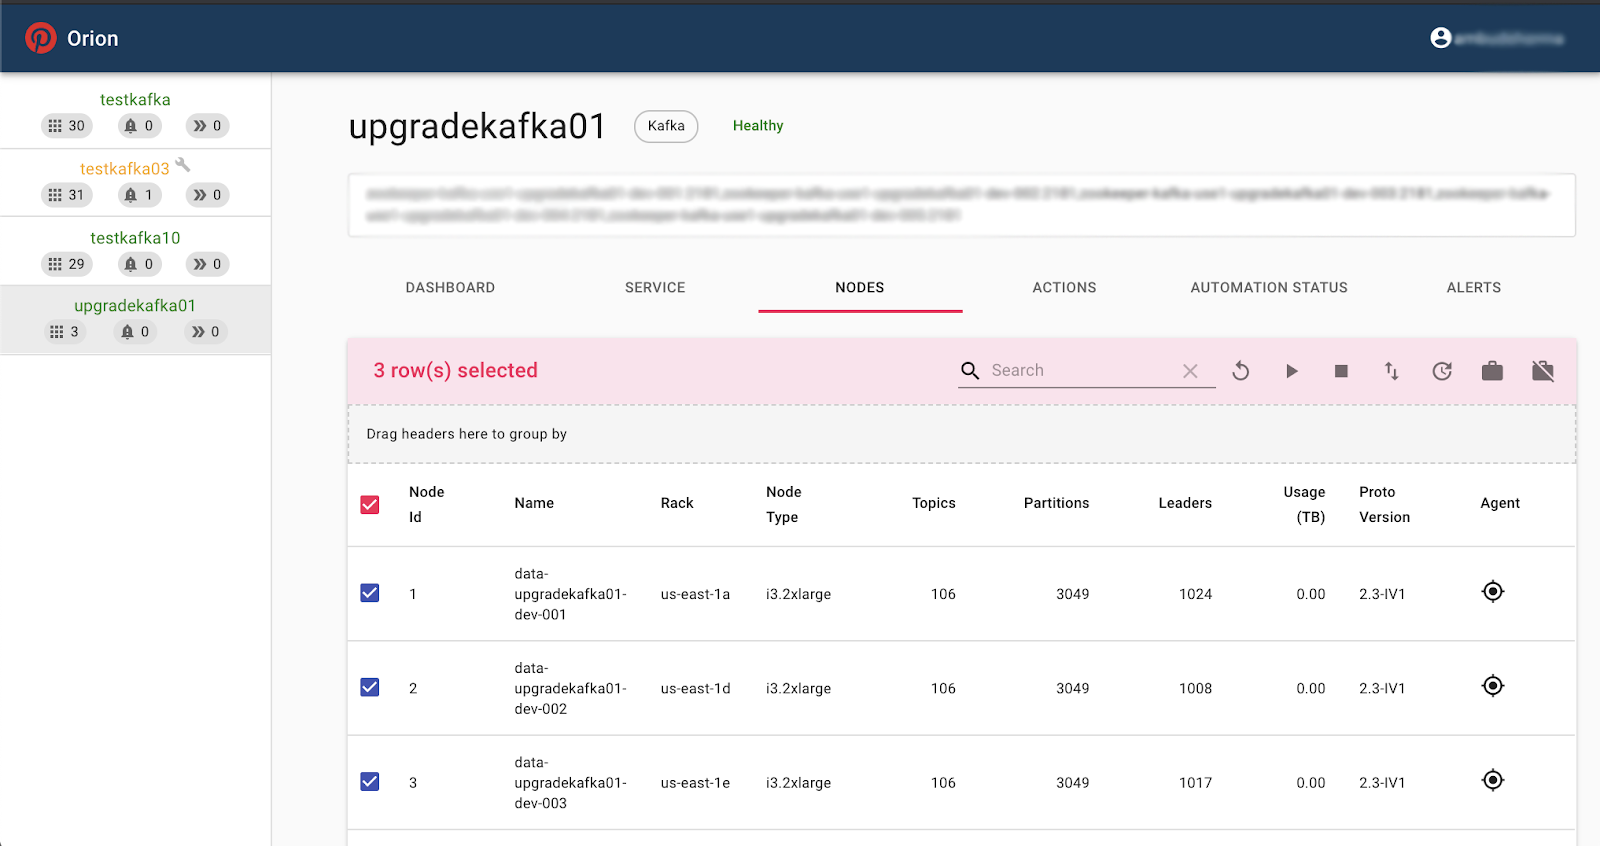 |
Some of Orion’s views
Topic creation
Up until last year, we used CMAK and made it available to customers for creating and configuring their own topics. Unfortunately, this topic creation model led to several problems over time:
- Customers did not necessarily know the right Kafka cluster to host their new topic
- Customers did not necessarily know the proper configuration (number of partitions, retention, etc.) for their new topic
- Customers did not know whether the host Kafka cluster had enough capacity to handle traffic in and out of their new topic
- Random (non-load-aware) topic assignments often generated severe cluster balancing issues
- Typos could easily lead to unintended consequences as the topic creation did not go through automated validation or human review
These issues were too much to ignore considering the fast-growing number of use cases and Kafka topics that had to be created to support them. In response, we moved toward a managed topic model to factor in the current state of the cluster before adding a new topic and also avoided additional overhead for customers to create or reconfigure topics.
We created an extension in our UI (Aerial) by adding a wizard for topic creation that asks for some critical information about the topic that is being created. It generates a PR that is sent to the Logging Platform for approval. Once approved and landed, Orion automatically creates the topic on the specified brokerset and notifies the customer of the topic creation. In most use cases, the number of partitions is flexible and the wizard comes up with the proper partition count and placement based on the projected topic throughout and the current cluster metrics and brokersets. Once created, Orion monitors the topic and its health and performs automated healing actions when necessary.
Lineage
Once a pipeline is set up and traffic starts to flow in and out of a topic, customers can see a bird’s-eye view of that pipeline and the data flow among different components. The image below shows which Singer host the pipeline initiates from, which Kafka topic those logs are written to, and which S3 Transporter pipelines receive those logs. For each node in this data ingestion route, there are links that can point the customer to the related component’s configuration. Aerial tracks the end-to-end lineage for our team’s services and makes it available to our customers for self-service troubleshooting and investigation.
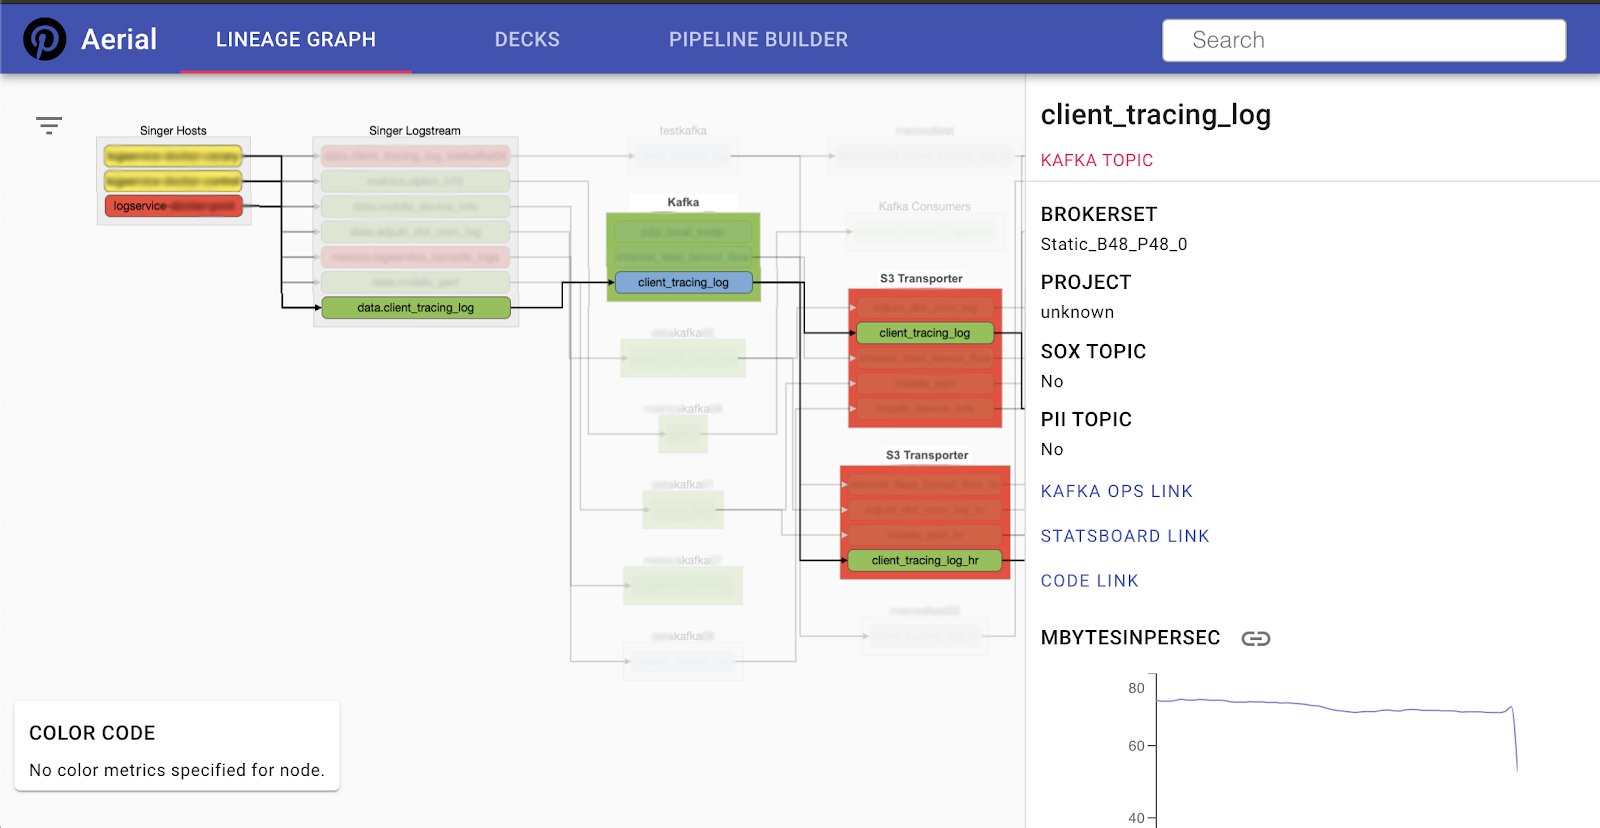 Data ingestion lineage
Kafka upgrade
In 2020, we upgraded all our Kafka clusters to bring consistency to their broker version, their inter-broker protocol version, and their default log message format version. To review, here are the key pieces that were involved:
- Broker version is the version of Kafka binary that a broker runs. We now run version 2.3.1 with some cherry-picked commits.
- Inter-broker protocol version is the version used by brokers to communicate with each other. The maximum valid inter-broker protocol version is the lowest broker version in the cluster. This version cannot be downgraded after an upgrade without cluster shutdown. We now run version 2.3-IV1.
- Log message format version is the version of the log format that a broker uses to write messages to disk. The default log message format version of a broker can be overridden by each topic. This version guarantees that messages on disk have a maximum version that is configured for the topic or (if not overridden) the default cluster version. The log message format can be tricky to upgrade, as old consumers prior to version 0.10.2 do not support newer log message formats. Plus, the mismatch of log message format versions between clients and the broker can result in message format conversion, which adds additional CPU load on the broker. Log message format conversion happens when old clients (e.g., an old Scala API) do not understand newer log message formats, the broker has to take care of down-converting the message format for consumers, and the broker has to take care of up-converting it for producers. We now run version 2.3-IV1 as the default version on all clusters.
The following table color codes different versions of Kafka brokers, the inter-broker protocol, and log message format. It shows where we were before the upgrade (columns with a variety of colors) and where we are now (uniformly colored columns on the right) with our Kafka clusters. It shows that we were almost consistent prior to the upgrade with respect to the broker version in use (2.0.0). Ideally, we should have been similarly consistent on inter-broker protocol versions, as they should be upgraded right after broker upgrades, and there is no particular reason why broker versions are upgraded but inter-broker protocol versions are not. This was tech debt on our side that we resolved during the 2020 upgrades.
The main inconsistency, however, was with log message protocol versions, which was the riskiest part of the upgrade. Upgrading the log message format version required ensuring that there is no old client that could stop working after the upgrade or impose additional load on the cluster (i.e., due to log message format conversion). As mentioned earlier, these conversions pose additional CPU usage on the cluster, because the brokers have to decode and re-encode all the messages in a batch and could impact broker performance (latencies/throughput). This is particularly expensive for compressed topics. Upgrading old log message formats was the most time-consuming part of our upgrade since it involved digging into what Kafka client library version was using each topic. Note that KIP-511, which is fully included in 2.5.0, fills this gap from the Kafka broker point of view.
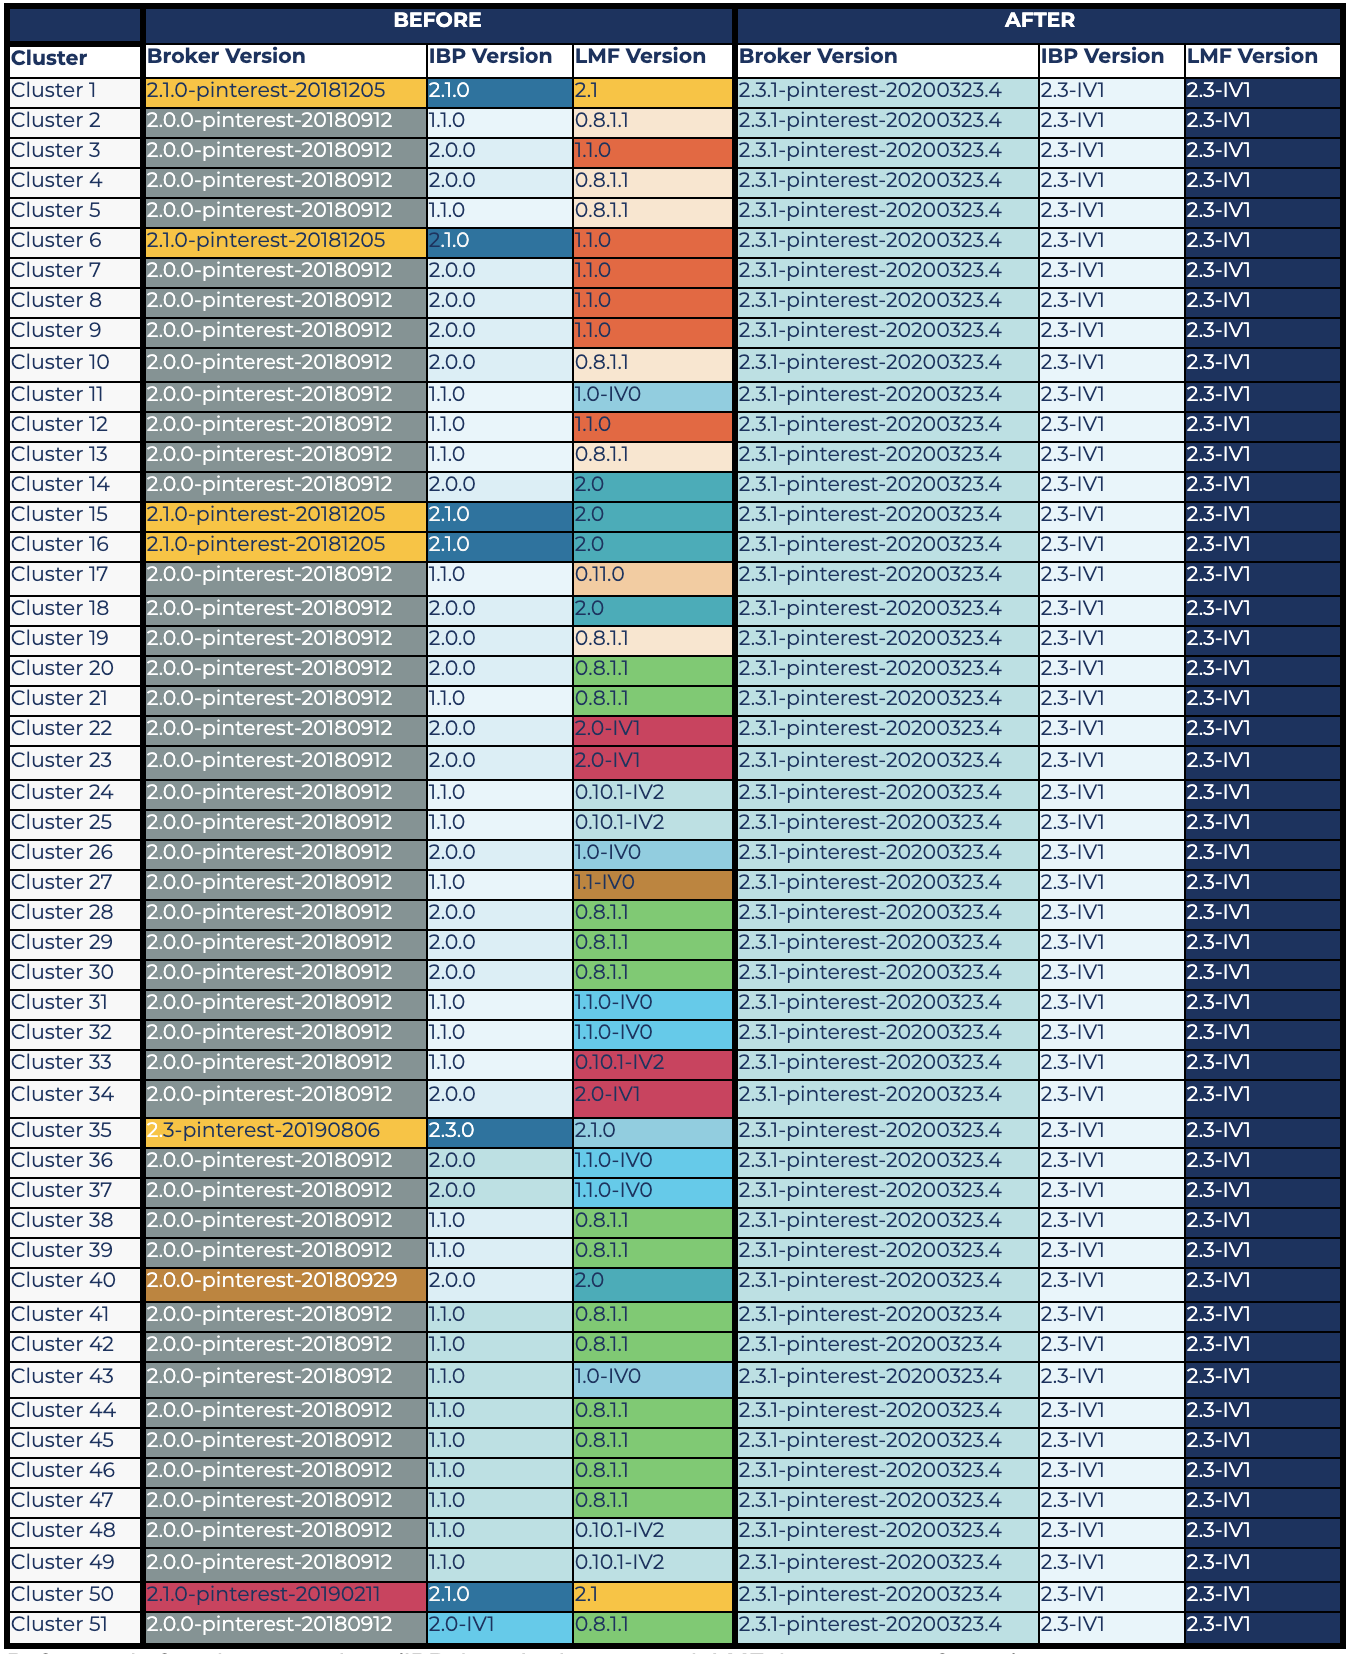 Before and after cluster versions (IBP: inter-broker protocol; LMF: log message format)
Lessons learned on upgrades
Based on our experience performing these upgrades, we’ve gathered some useful lessons to share.
Choose a bug fix release
Most major release versions that are filled with new features are not properly battle-tested before the release, and several bug fixes typically follow in minor releases. Therefore, it is safer to go with a bug fix release, which is why we chose 2.3.1 and not 2.3.0.
However, there is no guarantee that bugs won’t creep into bug fix releases. We actually ran into KAFKA-9752, which is a side effect of the static group membership feature that was implemented through several commits across multiple releases. Since then, we’re better prepared to skip releases if necessary.
Having an internal fork of Kafka where patches can be applied is tremendously helpful to our team because it does not prevent us from applying specific fixes to our environment.
Check filed issues
After choosing a candidate release, we first look at the list of all issues filed against that version. Specifically, we consider blockers and critical, major bugs, and decide whether any of them are showstoppers. If so, there are a few options:
- If the showstoppers are fixed in a follow-up minor release, we choose that version instead
- If the showstoppers are fixed but not released yet, we try to cherry-pick those fixes and use that release plus cherry-picked commits as our candidate broker version
- If none of the above applies, we pick a different release as our upgrade candidate
For our upgrade, we considered these bugs, and after confirming that the important ones for us were already fixed, we cherry-picked several fixes to create the upgrade candidate. Note that 2.3.2 was not available at the time.
Due diligence
Since we operate a mission-critical environment, it is prudent not to simply trust that a Kafka release would work well just because it is certified by the Kafka community. Once we select a candidate version, we try to create pipelines identical to our production pipelines. For us, this is often very easy because we can enable double publishing on the Singer side and the S3 Transporter for the test cluster. Once this is set up, we compare the important metrics (throughput, CPU usage, as well as data integrity validations) to certify our internal release. We’ve created an internal suite of validation checklists that can be repeatedly executed each time an upgrade is being evaluated.
We initially planned to upgrade to 2.4.1, but during our testing of this version, we noticed that the number of fetch requests unexpectedly spiked (almost doubled) after the upgrade, which caused the CPU usage of brokers to go up. The issue turned out to be a side effect of KIP-392 implementation and unnecessary watermark propagation in the default leader selector case. The fix for this issue was included in the 2.6.0 release. At Pinterest’s scale, this CPU spike was unacceptable due to its impact on resource usage (cost) and client SLAs; therefore, we had to change course and go with 2.3.1.
Verify clients when upgrading log message format version
When upgrading clusters that are on a very old log message format version, we verify that none of the clients are on a client library version that would break once the log message format version is upgraded. If there are old clients like this, we make sure that those clients upgrade their Kafka client library version to a compatible version before upgrading the log message format version of the cluster. If, for some reason, certain clients cannot be upgraded, we do a log message format version override for the topics they work with so that the format version of those topics is not upgraded when the default format version is bumped. Also, note that for special cases/exceptions, we were able to isolate topics using brokersets that allowed us to provision the capacity needed to support message conversions as needed.
We went through a comprehensive exercise to understand how the log message format version upgrade would impact different client library versions of Java (native), C++ (librdkafka), Python (kafka-python and confluent-kafka-python), etc. This helped us understand whether any existing client would break and also whether any would lead to message format conversion when the default format version on the cluster is upgraded.
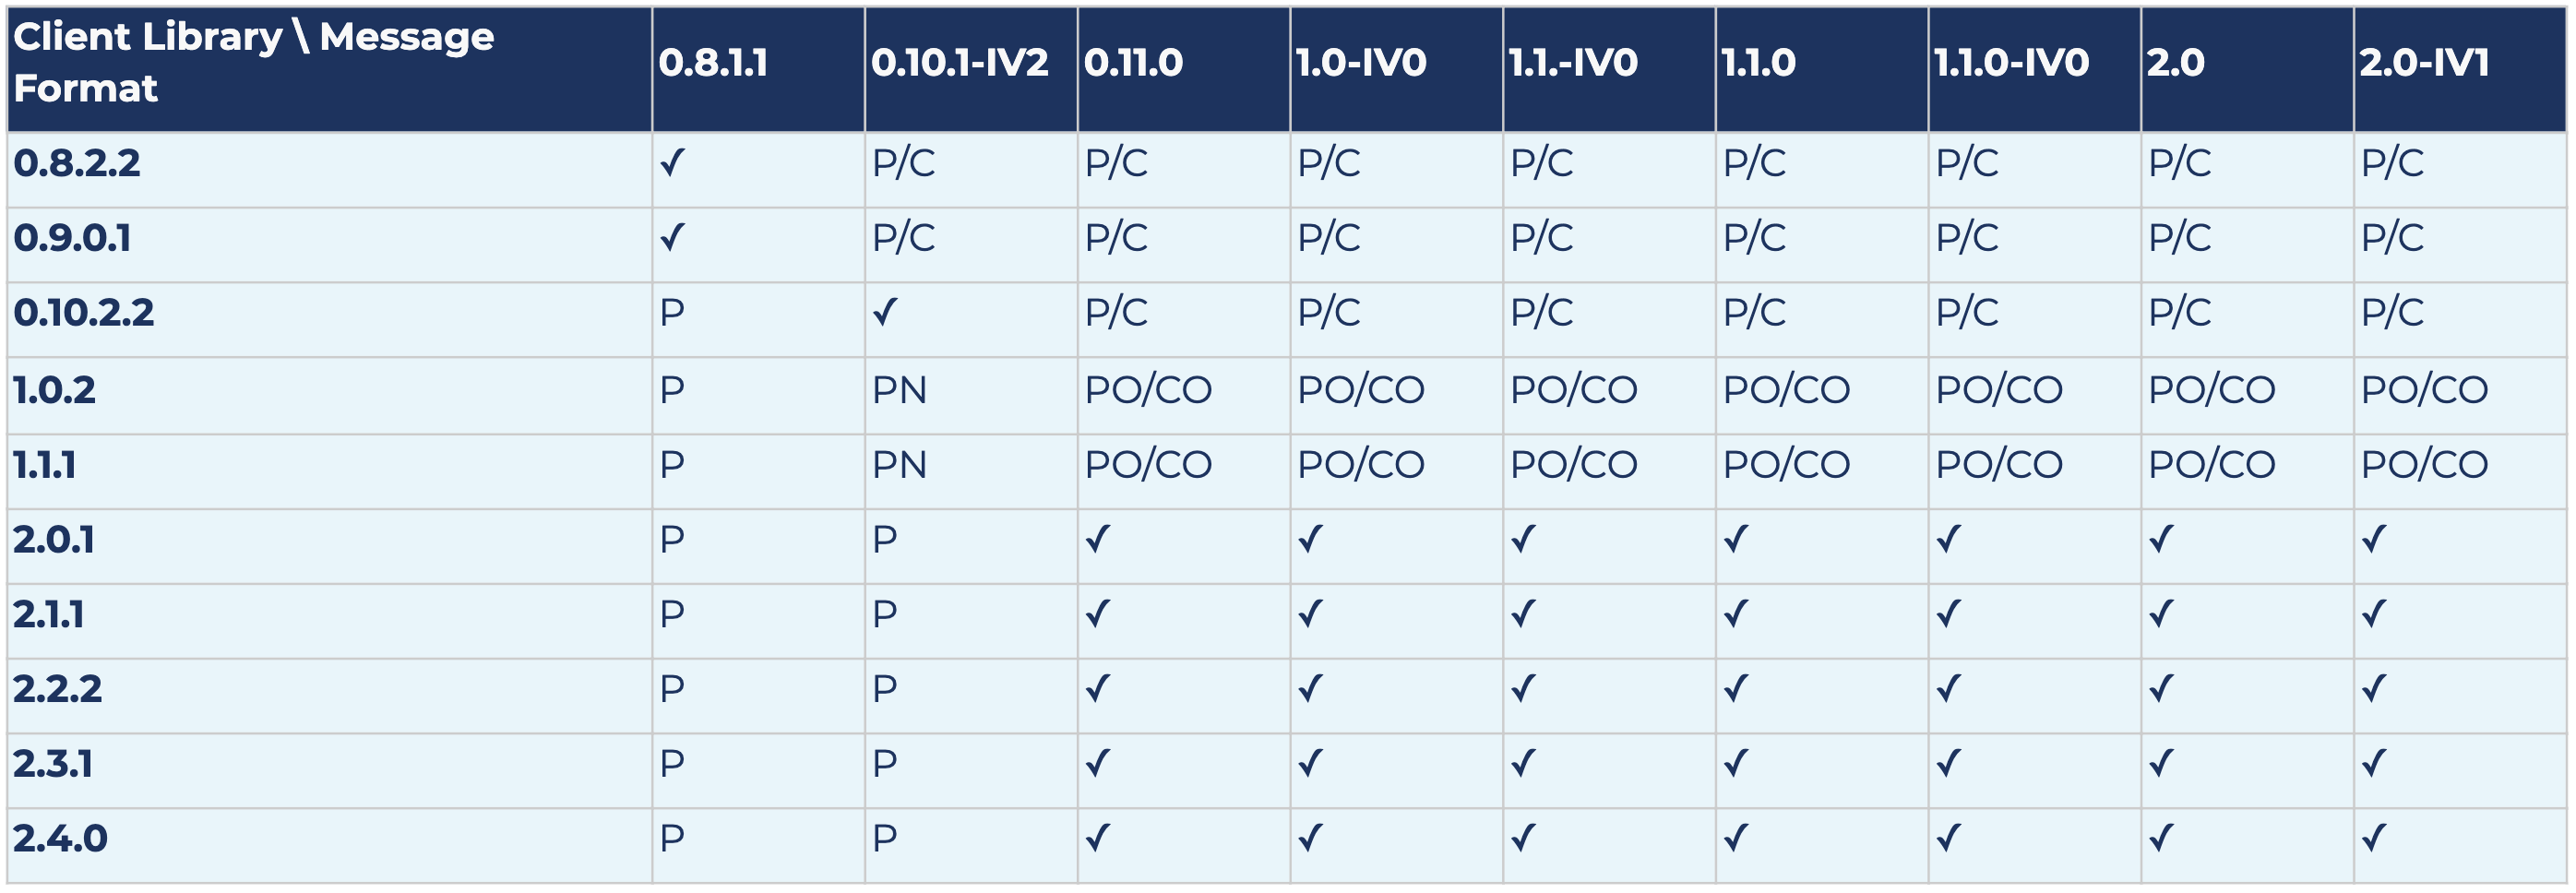
The following results show compatibility and also potential message conversion after upgrading log message format versions for Kafka version 2.0.0. Each row represents the results for a specific client library version, and each column represents the results for a specific log message format version.
The following is a key to the table below:
- ✓ means there is no message conversion; the client is fully compatible with the log message format version
- P means that produced messages are converted (both old and new APIs)
- PO means that only messages produced by the old producer API are converted; the old producer is no longer supported starting from 2.0.0
- PN means that only messages produced by the new producer API are converted
- C means that consumed messages are converted (both old and new APIs)
- CO means that only messages consumed by the old consumer API are converted; the old consumer is no longer supported starting from 2.0.0
- CN means that only messages consumed by the new consumer API are converted
Scala/Java
librdkafka

kafka-python

confluent-kafka-python

confluent-kafka-go

Future work
We are actively working on improving Logging Platform services at Pinterest and providing a better experience to our customers. The main focus areas at the moment include:
- Interoperability: Several aspects of Kafka client libraries can be too complex for customers. In most cases, all consumers need to do is to produce messages to a topic or consume messages from it. They are not and should not be concerned with:
- Most client configurations and how to optimize the Kafka client
- Where their topic is hosted
- How to find producer/consumer metrics for their client
- Troubleshooting issues with a Kafka client
- Applying Kafka client best practices
There are several other reasons why we started implementing a generic pub/sub client that abstracts the backend pub/sub system for consumers and addresses the gaps mentioned above. We believe this provides a win-win situation for the Logging Platform and its customers, because the Logging Platform will have more control and visibility into how clients interact with Kafka clusters. Furthermore, customers will not have to worry about issues and incidents when the pub/sub client library is at fault. It also enables us to provide other pub/sub system offerings in our environment when they are a better fit for specific use cases.
- Scale and efficiency: We are exploring options to automate scaling of Kafka clusters when traffic patterns change, while at the same time, seeking ways to reduce the cost incurred by a Kafka cluster per GB of data that goes in and out of it. We have also been working on improving MirrorMaker performance to improve both stability and scalability of mirroring data across Kafka clusters. KIP-712 entails one aspect of these improvements.
- Reliability: We are gradually promoting Orion as our first line of defense for incidents so that auto-resolvable incidents can be addressed without human intervention and only the issues that require an engineer’s attention are escalated. We also recently completed the rollout of message corruption and data loss detection across critical pipelines to better understand if and to what extent message corruption and data loss impacts our services. We plan to make this the default for all pipelines at Pinterest.
If you’d like to learn more, check out our Kafka Summit talk: Organic Growth and a Good Night’s Sleep: Effective Kafka Operations at Pinterest.
Our progress would not have been possible without tremendous contributions by Eric Lopez, Heng Zhang, Henry Cai, Jeff Xiang, and Ping-Min Lin.
Ist dieser Blog-Beitrag interessant? Jetzt teilen
Confluent-Blog abonnieren
Chopped: AI Edition - Building a Meal Planner
Dinnertime with picky toddlers is chaos, so I built an AI-powered meal planner using event-driven multi-agent systems. With Kafka, Flink, and LangChain, agents handle meal planning, syncing preferences, and optimizing grocery lists. This architecture isn’t just for food, it can tackle any workflow.
Predictive Analytics: How Generative AI and Data Streaming Work Together to Forecast the Future
Discover how predictive analytics, powered by generative AI and data streaming, transforms business decisions with real-time insights, accurate forecasts, and innovation.

