[Virtuelles Event] GenAI Streamposium: Lerne, Echtzeit-GenAI-Apps zu entwickeln und zu skalieren | Jetzt registrieren
Introducing Single Message Transforms and New Connector Features on Confluent Cloud
Data silos across an organization are common, with valuable business insights waiting to be uncovered. This is why at Confluent we built a portfolio of fully managed connectors to enable you to easily integrate Confluent with high-value data systems and apps without any operational burden. As we continue to invest in this area, we’ve found that not only is it important to add new source and sink connectors to address your critical use cases, but it’s equally important for our users to get more value and usability out of all of our fully managed connectors beyond their core functionality.
That’s why we’re excited to announce that most of our Confluent Cloud connectors now support single message transforms, connector log events, and connector data output previews. These features enable you to transform, monitor, and preview connector data, opening up lightweight real-time processing capabilities and delivering additional transparency and insights during your data integration journey.
In this blog post, we’ll dive into each of these new features to discuss why we’ve built them, cover common use cases, and show you how to start using them in just a few clicks.
Single message transforms (SMTs) for Cloud
Previously available only on self-managed connectors through the Kafka Connect API, single message transforms (SMTs) are simple and lightweight modifications to message values, keys, and headers. As the name suggests, it can operate on every single message in your data pipeline as it passes through your source or sink connector. Bringing SMTs to fully managed connectors has been a popular request from our users because they are incredibly useful for inserting fields, masking information, routing events, and performing other minor data adjustments within the connector itself. Keep in mind that for more robust and heavy transformations, it is more suitable to use a stream processor like ksqlDB instead.
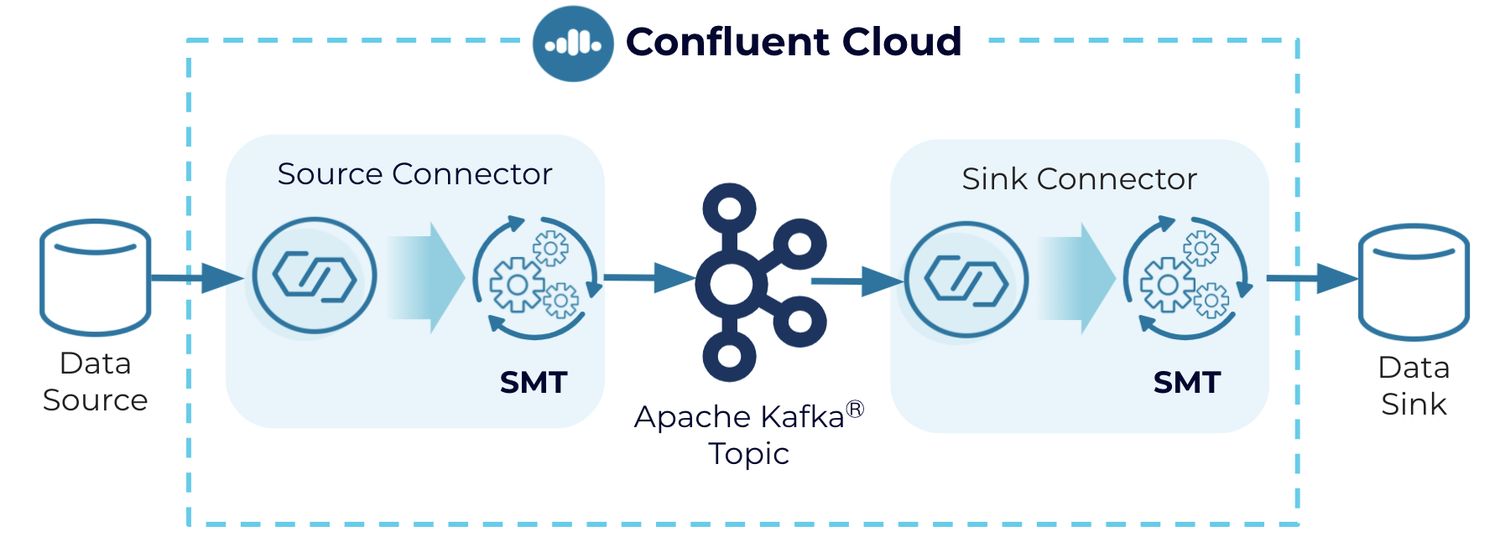
The transformations are applied to messages as they flow through the connector. SMTs transform inbound messages after a source connector has produced them, but before they are written to the Kafka topic. For outbound messages, the transformations happen before the messages are written to the sink system.
Some common uses for transforms are:
- Renaming fields: E.g. to avoid conflicts with naming during the transformation of data for GDPR compliance
- Masking values: E.g. to scrub protected health information (PHI) data before storing it in a data lake
- Routing records to topics based on a value: E.g. to build an analytics pipeline for sales reporting that routes records based on geographic regions
- Converting or inserting timestamps into the record: E.g. to add transaction timestamps to inventory data for order management
You can find the full list of pre-built SMTs that are available for use with fully managed connectors. SMTs can be implemented and managed using both the Cloud Console and CLI.
Let’s walk through an example of how an e-commerce retailer handles sensitive customer information. Oftentimes they’ll need to mask sensitive personal data to meet compliance regulations. Let’s say the retailer must mask the “gender” field before the customer data can be persisted to their data warehouse for further analysis by their data science team. We’ll demonstrate how SMTs (specifically, the MaskField Value transformation) will enable us to accomplish this before sending records to Kafka.
We’ll set up the SMT on the fully managed Datagen Source connector, which will simulate reading records from a table with customer data, apply the SMT, and send it to a Kafka topic.
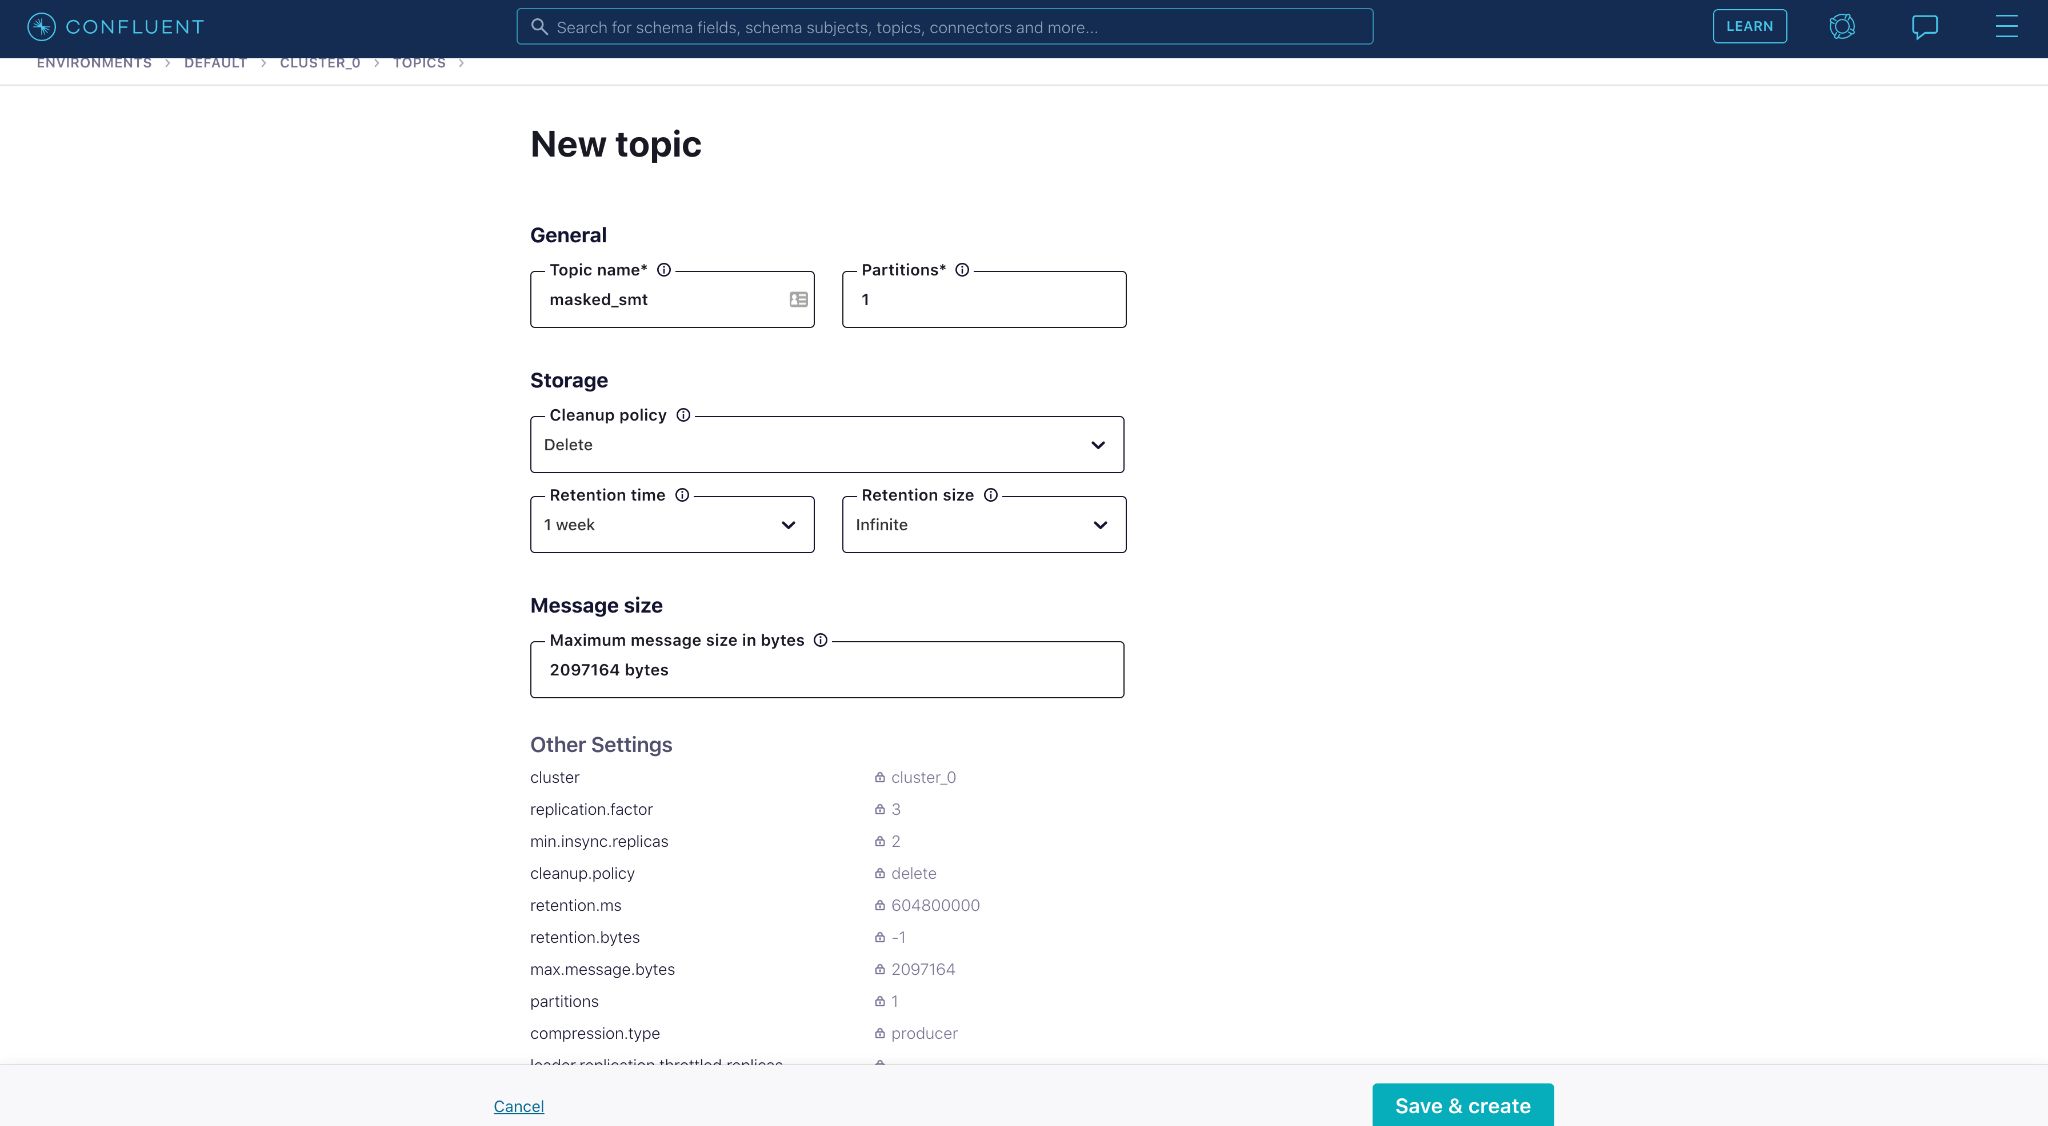
First, we need to create a topic “masked_smt”.
Once the topic is created, we can search for the fully managed Datagen Source connector and start configuring it. You can find SMT-related fields near the bottom of the connector configurations page.
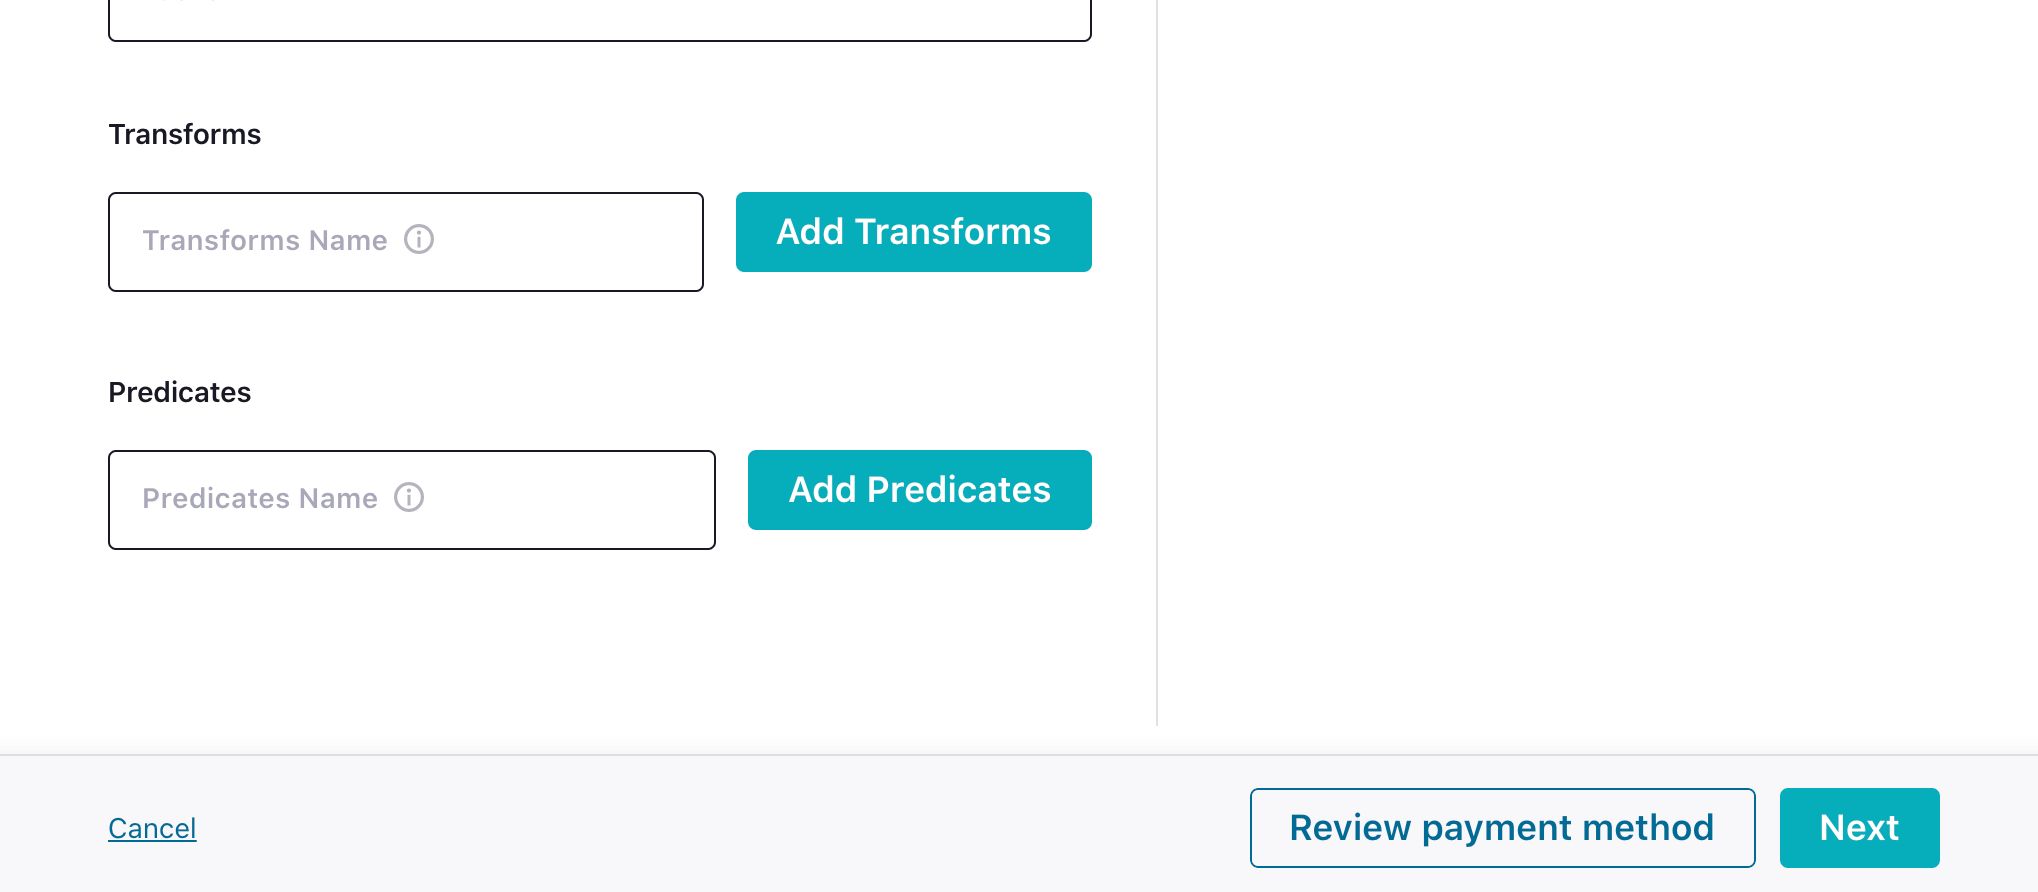
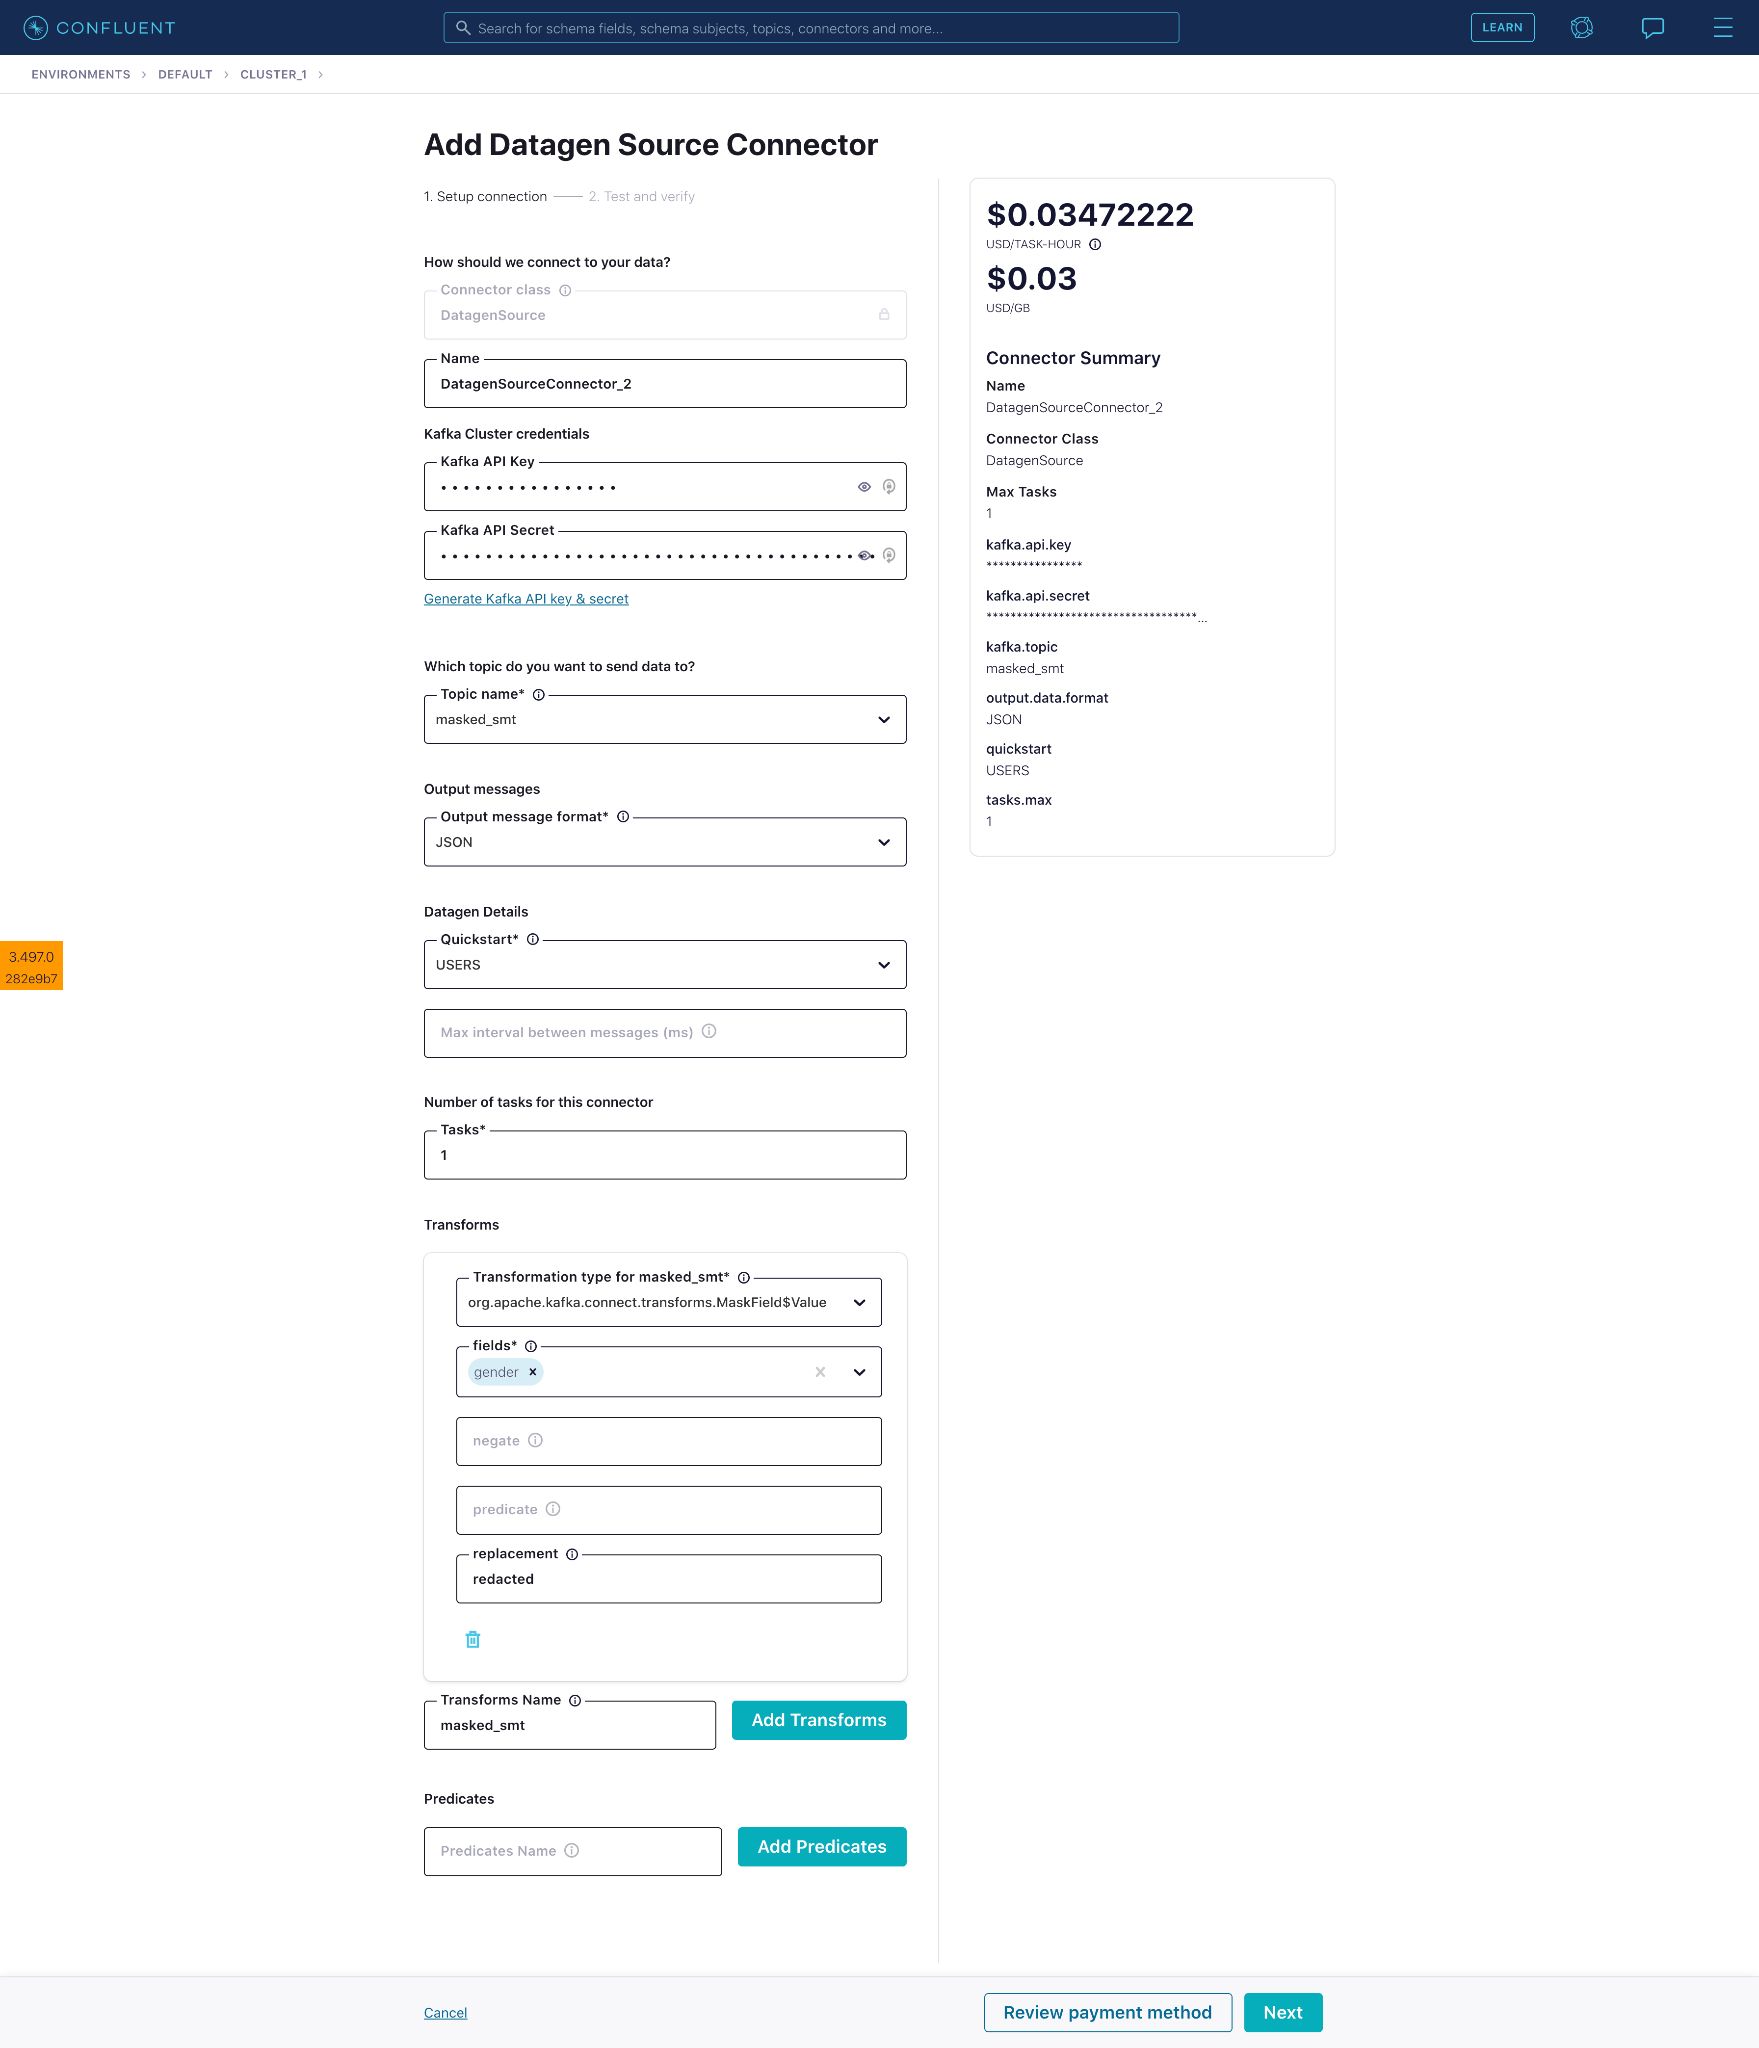
Enter a name for the SMT then click Add Transforms to reveal additional fields. Fill in the transformation type. Here, we have selected the MaskField$Value type within MaskField.
Select the field “gender” on which the masking will be applied. The “gender” field will be masked with the value provided in the “replacement” field, which we’ll replace with the word “redacted”.
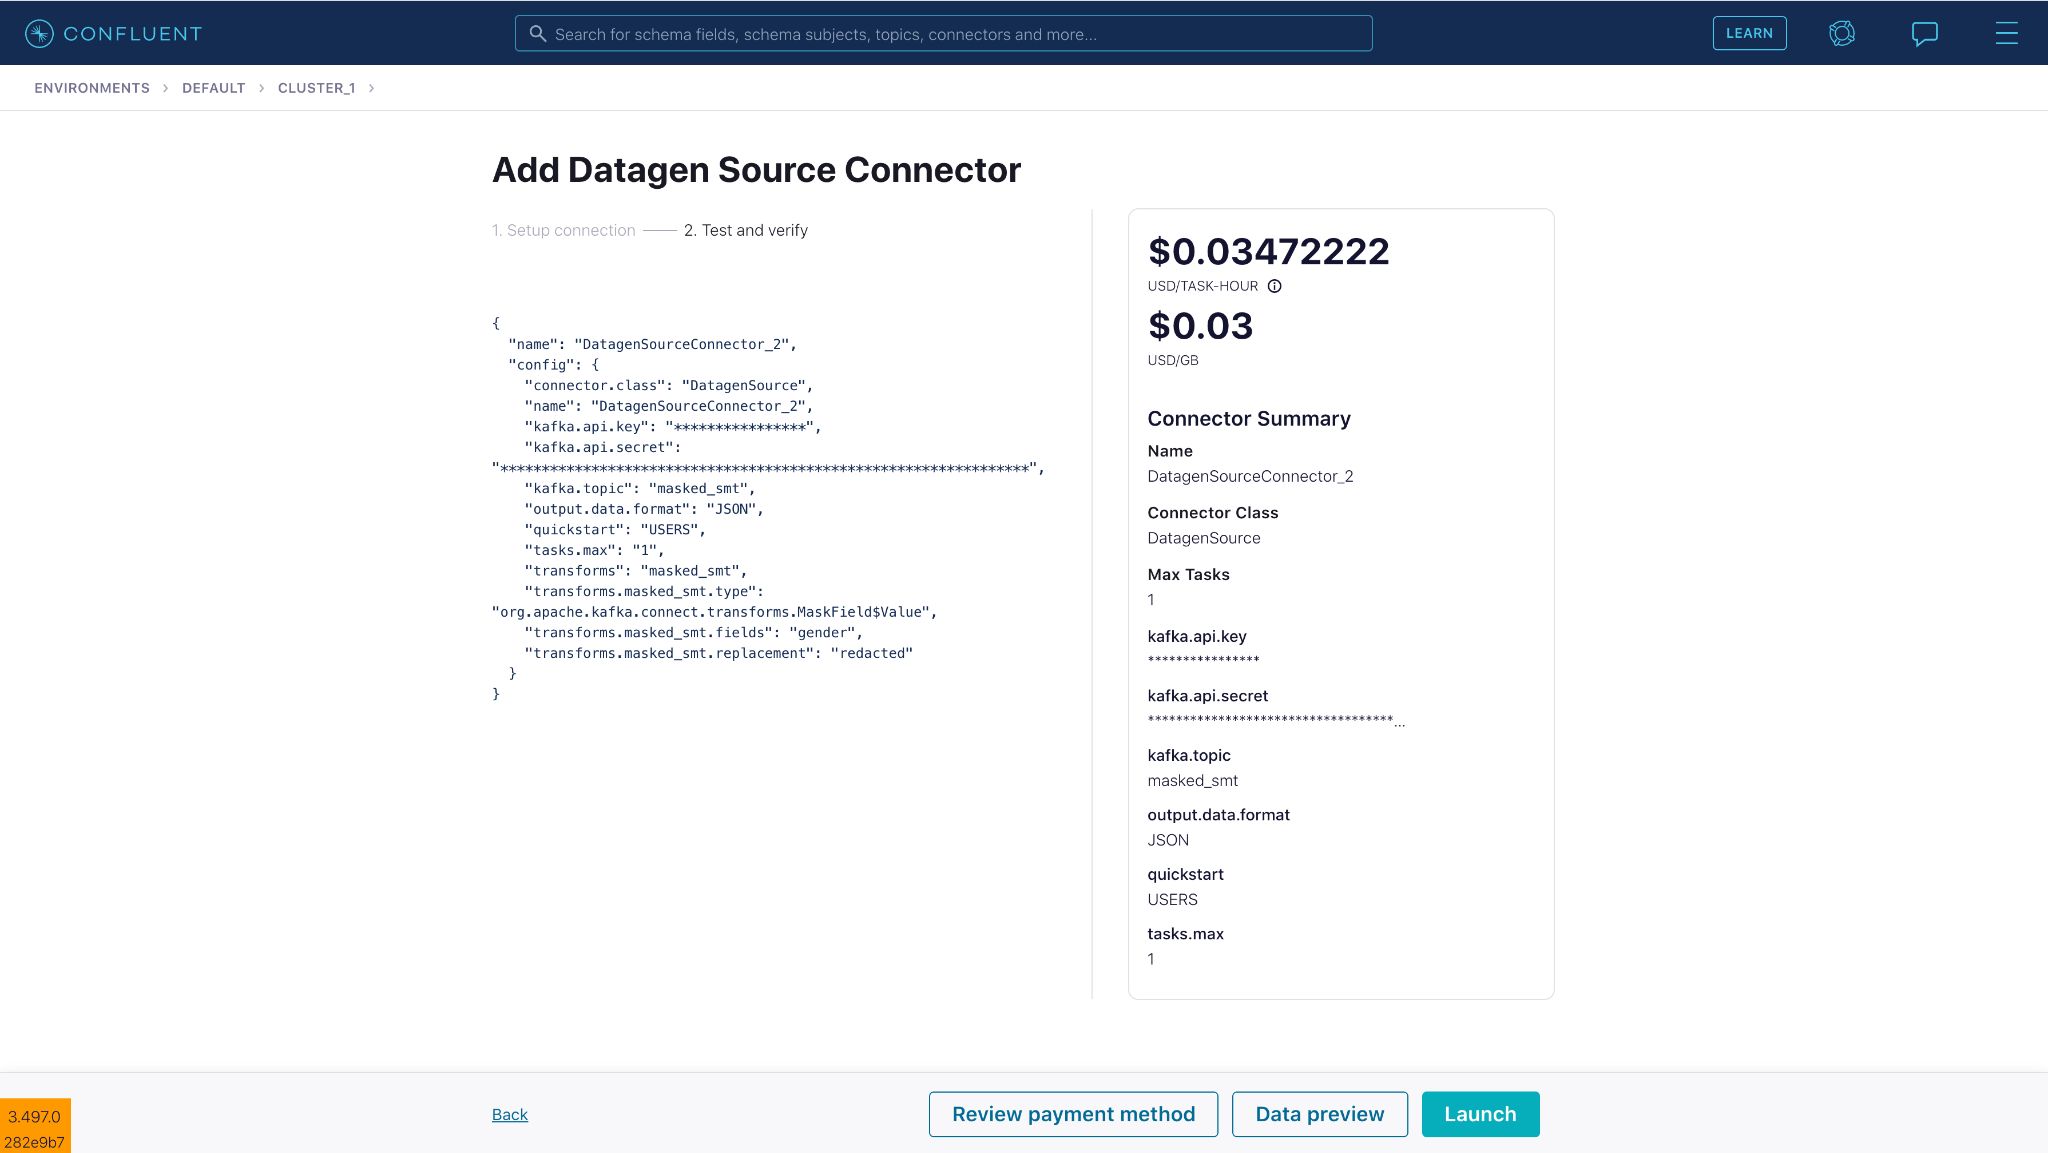
Connector configuration:
{
  "name": "DatagenSourceConnector_2",
  "config": {
    "connector.class": "DatagenSource",
    "name": "DatagenSourceConnector_2",
    "kafka.api.key": "****************",
    "kafka.api.secret": "****************************************************************",
    "kafka.topic": "masked_smt",
    "output.data.format": "JSON",
    "quickstart": "USERS",
    "tasks.max": "1",
    "transforms": "masked_smt",
    "transforms.masked_smt.type": "org.apache.kafka.connect.transforms.MaskField$Value",
    "transforms.masked_smt.fields": "gender",
    "transforms.masked_smt.replacement": "redacted"
  }
}
Once you launch the source connector, you can see SMTs in action on Confluent Cloud, masking the “gender” field successfully before sending it to Kafka.
Be sure to also check out all of the other transformation types supported within our fully managed source and sink connectors.
Connect log events
Historically, the events log of Confluent’s fully managed connectors was not exposed to the end user for visibility and context. For example, when connectors hit runtime issues, the customers would see a generic message of “Failed: Unexpected error occurred with connector. Support has been notified about the issue.”
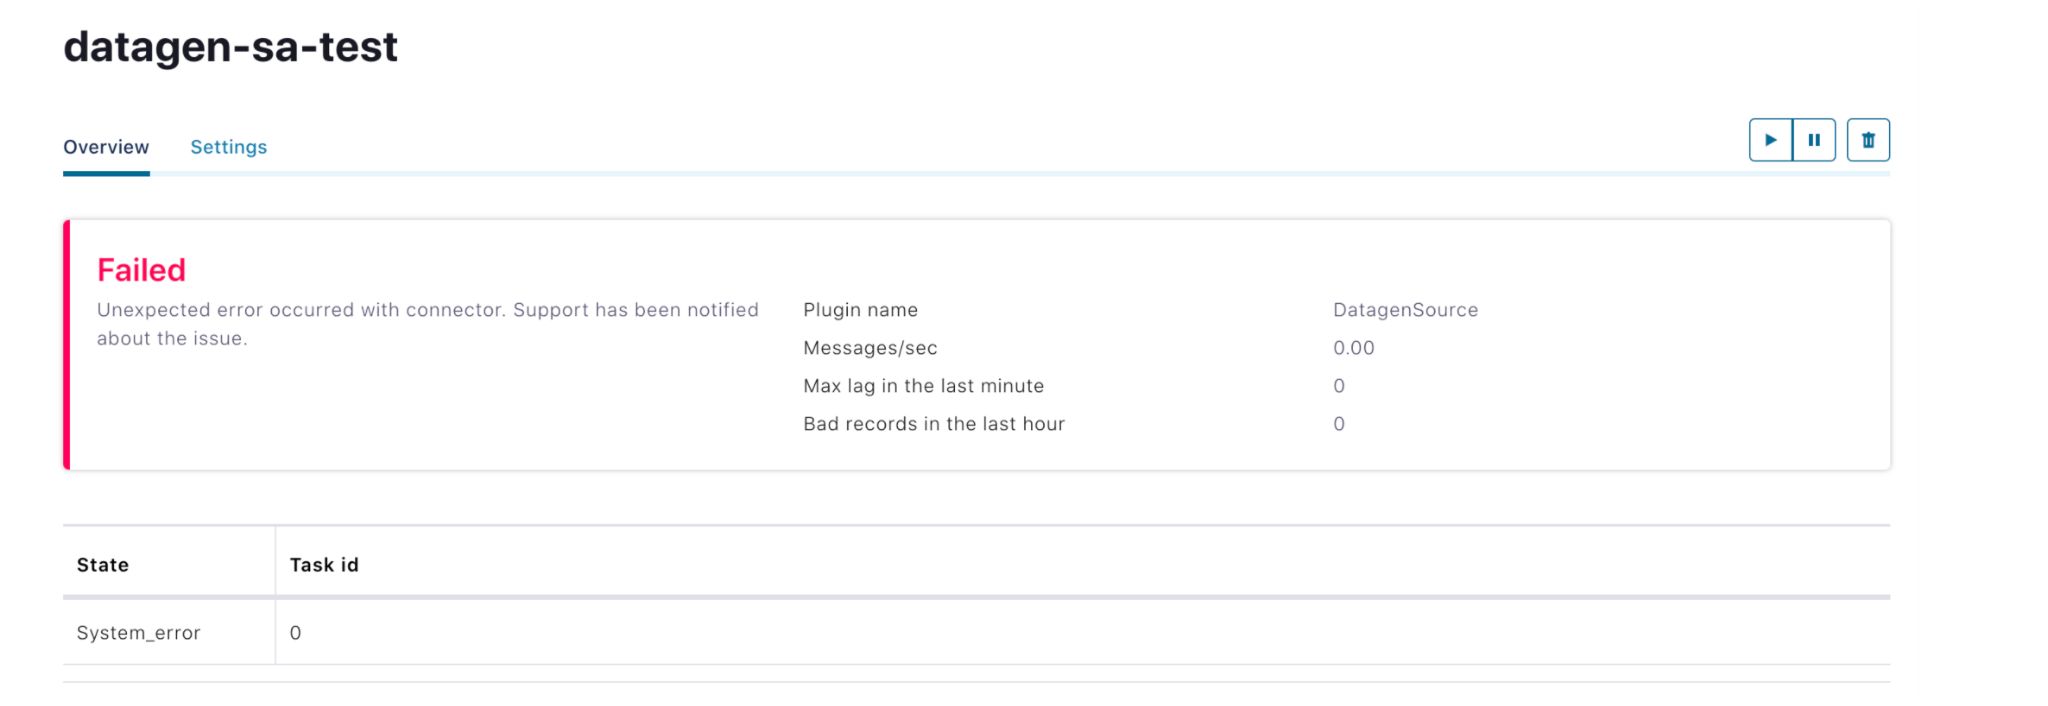
For troubleshooting, customers would have to reach out to Confluent’s customer support team, who in turn reach out to the Connect (on-call) engineers to find out more details about the specific error. This could cause delays in the debugging process and make it difficult for users to self-identify and correct errors or failures.
Our new feature connect log events solves this by exposing the connect logs to users for consumption. This feature improves operational transparency of the respective fully managed connectors to the users, providing contextual information like a view of how their connectors are progressing, which can be further leveraged by the user to build additional applications (like indexing of the error logs) on top of it. It’s not uncommon to run into a few errors when configuring a connector, so with connect log events users are now able to self-serve and identify the cause of the error, helping you to successfully resolve the issue.
Connect log events are available across all Standard and Dedicated Confluent Cloud clusters. You can view these events in the Confluent Cloud Console or consume these events from a topic using the Confluent Cloud CLI, Java, or C/C++ for output to a display or other application. Each event is structured in JSON format, as described by CloudEvents specification, to adhere with the common event schemas used across Confluent.
CloudEvent specification example:
{"namespace": "cloud.confluent.org",
"type": "record",
"name": "OrganizationEvent",
"fields": [
{"name": "id", "type": "string"},
{"name": "type", "type": "string"},
{"name": "schemaurl", "type": "string"},
...
{"name": "data", "type": "cloud.confluent.org.OrganizationEventData"}
]
}
To view step-by-step instructions for consuming records using Java and C/C++, navigate to Administrations in the menu and select Connect log events.
There you can find the in-product documentation of different ways to consume these events.
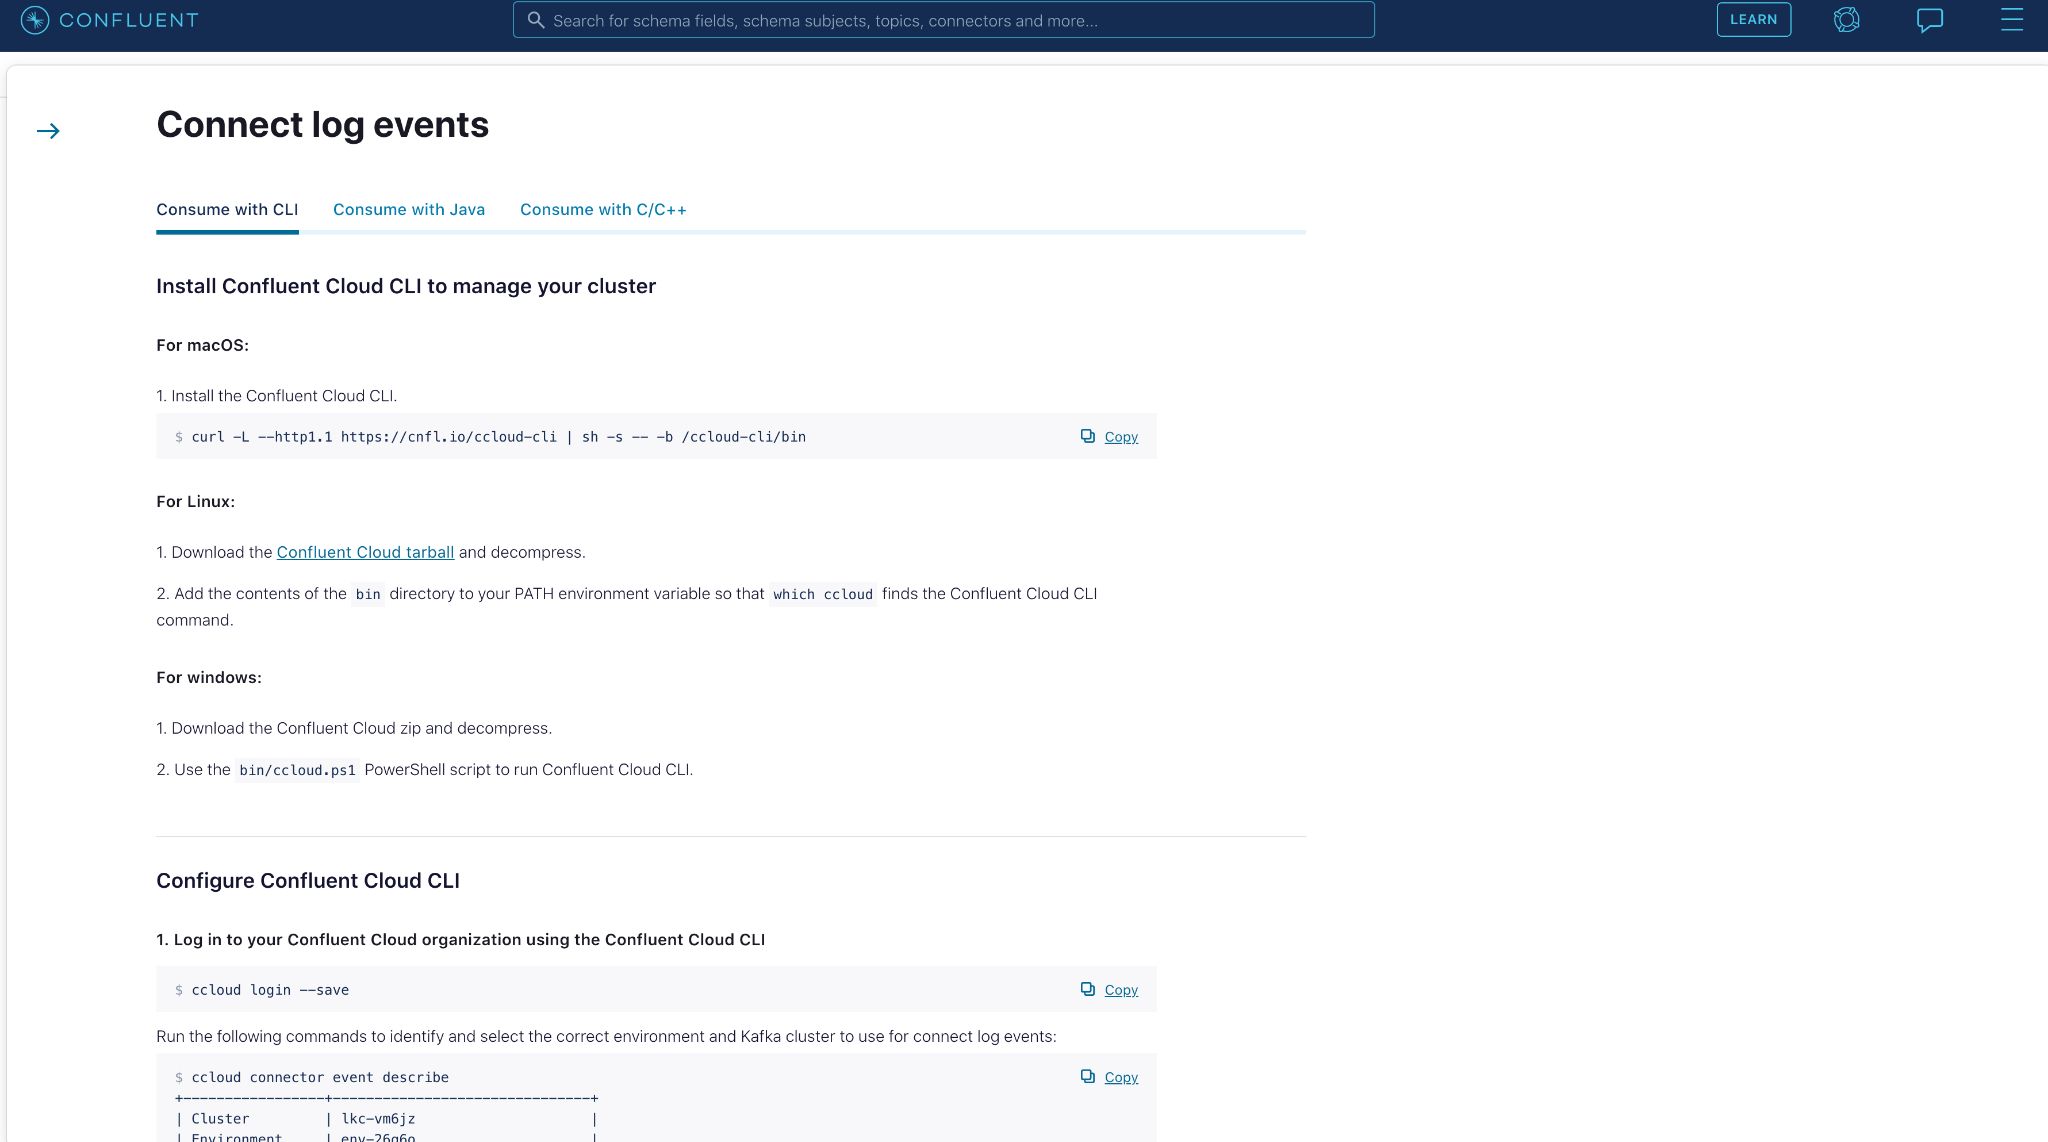
Most commonly, you’ll want to simply view the events in your Confluent Cloud console. In the case of connector failure, you can view the events generated with more descriptive error details.
With this added insight, you’ll be able to troubleshoot and resolve the error.
Connect data preview
Here’s a scenario familiar to our users of fully managed connectors. After launching a source connector, you’ll need to validate the messages written to a Kafka topic by checking the Kafka records. If what you see is different from what you expected, you’ll need to delete the topics and reconfigure the connector. You’ll have to repeat these steps until the written Kafka records reflect what you want. When using sink connectors, you can only validate records by stepping into the external sink system, which can be challenging as you don’t have control over what and how many records the connector sends to the sink system.
We can significantly reduce these steps and even remove them completely with the new connector data output preview feature. Connector data previews are essentially a dry-run functionality for the connector, with the actual connector configurations. Data previews provide users an accurate representation of the record structure that will be ingested to Kafka or the external systems, prior to actual ingestion, without launching the connector or ingesting any data. This feature is valuable for anyone developing or debugging a connector, helping with iterative testing and getting initial diagnosis much faster.
For example, a banking corporation wants to configure and launch a fully managed Salesforce Platform Event Source connector but they do not know how the Salesforce data will look once it is in Kafka. Creating a connector and then checking the Kafka records is one way to do it, but it is cumbersome and time consuming—especially if they discover that the data format is not expected or there is a data mismatch.
Instead, they can simply provide the connector configurations and click the Data preview button.
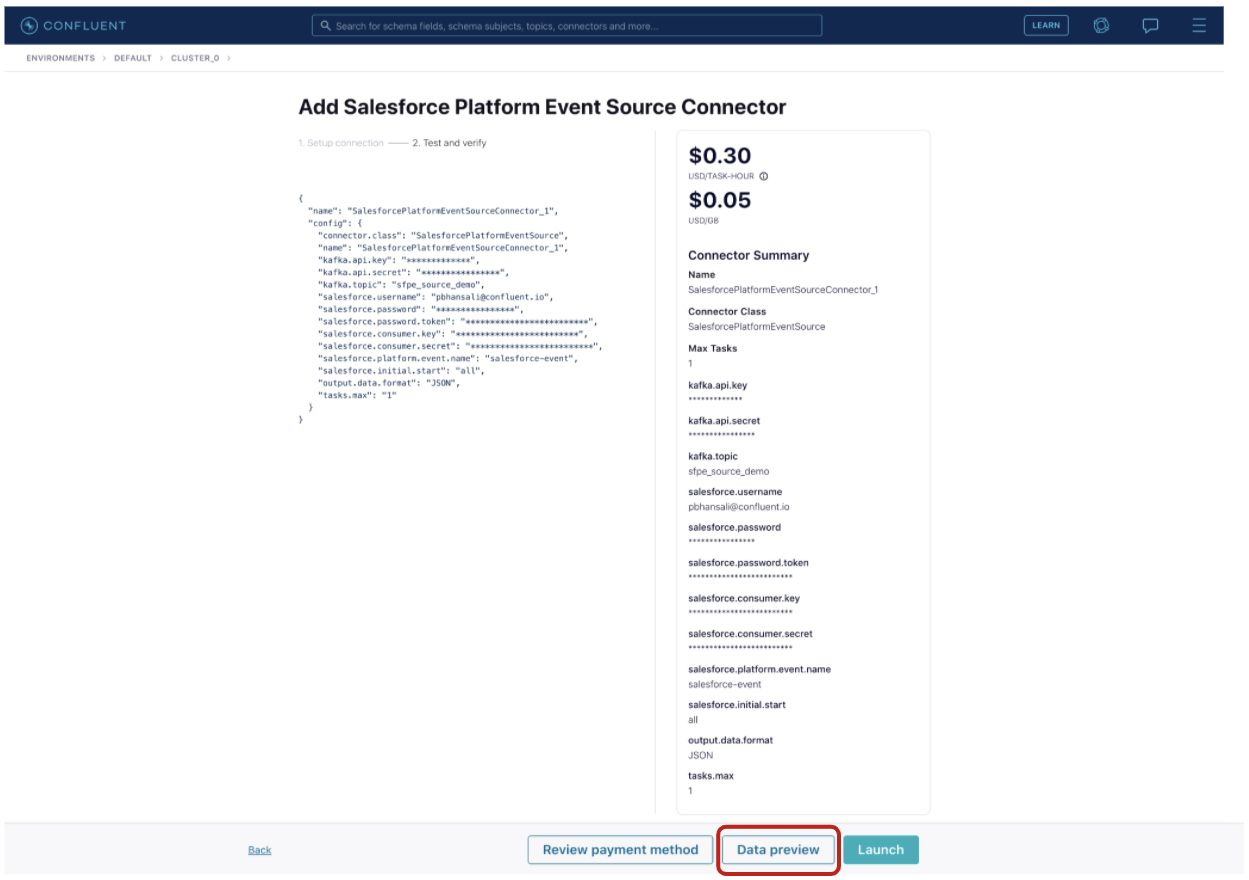
This will result in a new data preview request on the connectors page in the “Data preview request” section, which contains the user’s requested previews.
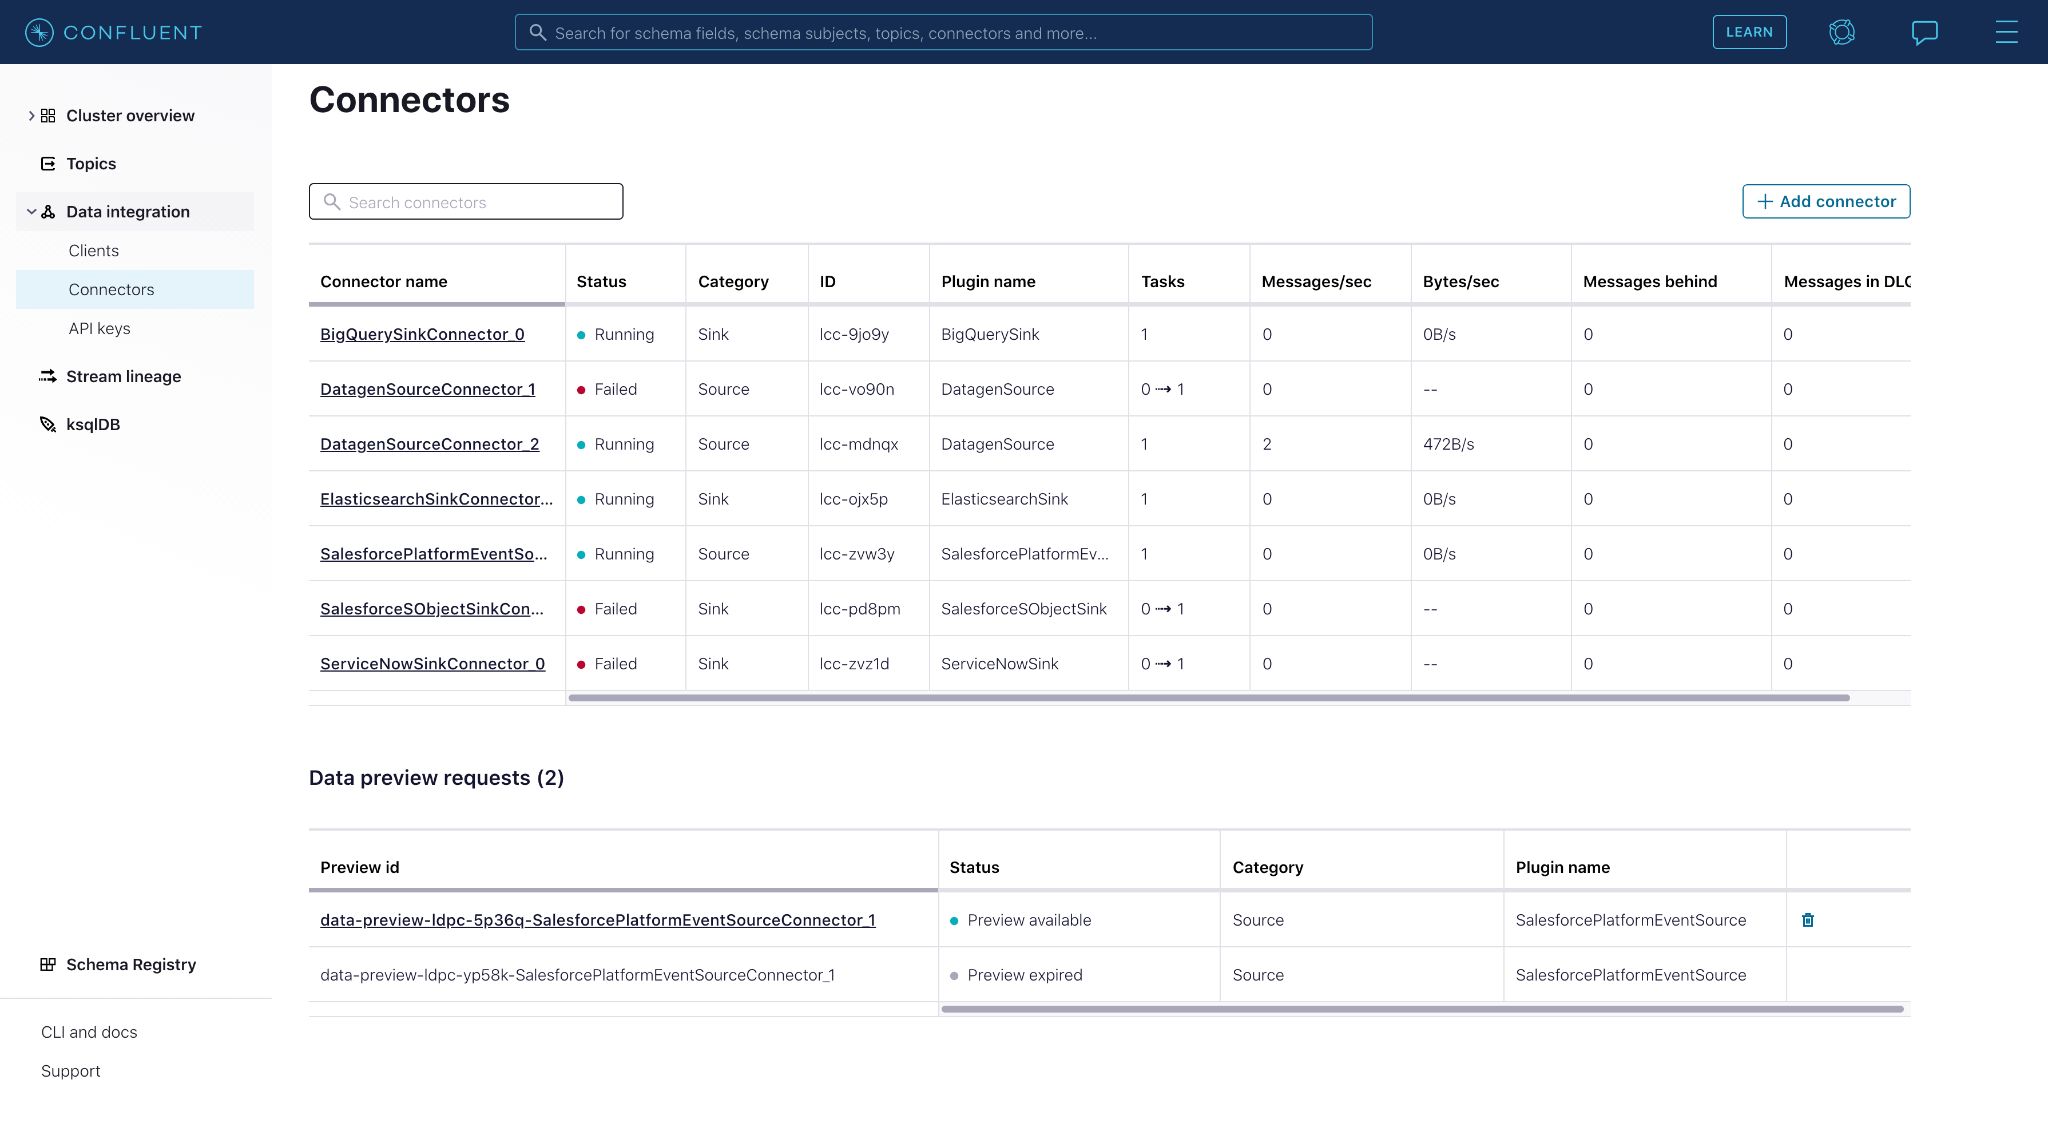
Clicking on the preview provides a look into the Salesforce data that will flow into the Kafka topic if the connector were launched.
After previewing the connector outputs, they can either launch the connector with confidence if the records are as expected or go back to editing the configurations if something doesn’t look right, saving time and extra steps.
Conclusion
We’ve introduced three new features for Confluent’s fully managed connectors: single message transforms, connect log events, and connector data output preview. Collectively, these features enable you to do more with your connectors and provide a better user experience.
If you are not already using our fully managed connectors, you can get started by signing up for a free trial of Confluent Cloud. Use the promo code CL60BLOG to get an additional $60 of free usage.*
Ist dieser Blog-Beitrag interessant? Jetzt teilen
Confluent-Blog abonnieren
New with Confluent Platform 7.9: Oracle XStream CDC Connector, Client-Side Field Level Encryption (EA), Confluent for VS Code, and More
This blog announces the general availability of Confluent Platform 7.9 and its latest key features: Oracle XStream CDC Connector, Client-Side Field Level Encryption (EA), Confluent for VS Code, and more.
Meet the Oracle XStream CDC Source Connector
Confluent's new Oracle XStream CDC Premium Connector delivers enterprise-grade performance with 2-3x throughput improvement over traditional approaches, eliminates costly Oracle GoldenGate licensing requirements, and seamlessly integrates with 120+ connectors...

