[Virtuelles Event] GenAI Streamposium: Lerne, Echtzeit-GenAI-Apps zu entwickeln und zu skalieren | Jetzt registrieren
Monitoring Your Event Streams: Tutorial for Observability Into Apache Kafka Clients
Why should you monitor your Apache Kafka® client applications? Apart from the usual reasons for monitoring any application, such as ensuring uptime SLAs, there are a few specific reasons for applications that work with Kafka. For example, misbehaving client applications can consume unnecessary resources of a Kafka cluster, similar to how a misbehaving JDBC application can impact the relational database that it works with. Another example is keeping track of the scaling needs of your applications: How many containers (or VMs/physical machines) does an application need to run so that it meets its performance SLAs and is able to keep up with the incoming load of streaming data?
Fortunately, Confluent Cloud fully manages the server side of Kafka alongside other fully managed features, such as Kafka connectors, Confluent Schema Registry, and ksqlDB. Combined with strong SLAs, Confluent frees up the time and resources you need to concentrate on creating and managing client applications that actually solve your business use cases.
If you are using Confluent, then now you may be wondering: Why should you monitor your Confluent resource usage? This may seem counterintuitive because services such as version upgrades and automatic data replacing are fully managed by Confluent. However, like AWS, Azure, and Google Cloud services, tracking resource usage is essential because Confluent sets usage limits for its cloud services that vary by cluster type.
Hitting a limit may result in denied requests or delayed request processing—for example, when a rogue application creates too many connection attempts to a Confluent cluster within a short time span. This may then impact other applications that use the same cluster. If you don’t monitor your Confluent usage, it may impact your ability to pinpoint applications that misbehave, scale, and tune your applications for optimal performance.
This blog post is part 2 of the Monitoring Your Event Streams blog series. The first blog post in the series shared how to scrape, aggregate, and dashboard Confluent ecosystem metrics. This blog post details how to perform similar tasks with Kafka client applications running in the cloud, specifically monitoring Confluent and client applications, and it features various client scenarios through a monitoring lens. A new tutorial, Observability for Apache Kafka Clients to Confluent Cloud, is used to illustrate these concepts and show how various failure scenarios manifest themselves in metrics and logs.
Observability for Kafka clients to Confluent Cloud
The Observability for Apache Kafka Clients to Confluent Cloud tutorial showcases various scenarios. The tutorial creates a Confluent cluster, runs Java applications to produce data to the cluster, and runs Java applications to read data from the cluster. The example then uses a time series database for the client metrics and Confluent metrics and displays them using visualization software. The tutorial walks through various scenarios (failure scenarios, hitting usage limits, etc.) to see how the applications are impacted and how the dashboards reflect the scenario so you can learn what to look for.
The example uses Prometheus and Grafana, but the same principles can be applied to any other time series database or visualization technology. The example also showcases Java clients and their JMX metrics, but you can do the same with non-Java clients—they generally offer similar metrics. For example, librdkafka-based client libraries (for C/C++, Go, and Python) should have the option to emit client metrics by setting the statistics.interval.ms configuration. Similar to Java applications, librdkafka-based clients need a process that transforms and helps facilitate the ingestion of metrics into a datastore. While there are solutions out there, this blog post does not advise on what technologies and processes to use.
Part 1 of this series detailed JMX metrics and how they are transformed and loaded into Prometheus. This is useful if you want to know how to configure a jmx-exporter for a Java Kafka client, or you can reference the docker-compose.yml file in the observability tutorial. This blog post does not review that information; rather, the focus is on two other metrics exporters: kafka-lag-exporter and ccloud-exporter.
Consumer lag metrics are pulled from the kafka-lag-exporter container, a Scala open source project that collects data about consumer groups and presents them in a scrapable format. The observability tutorial incorporates the kafka-lag-exporter metrics into its consumer client dashboard. To configure the kafka-lag-exporter, create an application.conf, shown below, that contains the ID of your cluster (${CLOUD_CLUSTER}), Confluent bootstrap servers (${BOOTSTRAP_SERVERS}), and sasl.jaas.config (${SASL_JAAS_CONFIG}):
kafka-lag-exporter {
  port = 9999
  client-group-id = "kafkaLagExporter"
  lookup-table-size = 120
  clusters = [
    {
      name = ${CLOUD_CLUSTER}
      bootstrap-brokers = ${BOOTSTRAP_SERVERS}
      group-whitelist = ["demo-cloud-observability-1"]
      security.protocol = "SASL_SSL"
      sasl.jaas.config = ${SASL_JAAS_CONFIG}
      sasl.mechanism = "PLAIN"
      consumer-properties = {
              security.protocol = "SASL_SSL"
              sasl.jaas.config = ${SASL_JAAS_CONFIG}
              sasl.mechanism = "PLAIN"
              }
      admin-client-properties = {
              security.protocol = "SASL_SSL"
              sasl.jaas.config = ${SASL_JAAS_CONFIG}
              sasl.mechanism = "PLAIN"
              }
    }
  ]
}
The service account that is used needs permissions to describe cluster, consumer group, and topic resources. This exporter is also used in the jmx-monitoring-stacks project mentioned in part 1.
Currently, Confluent resource usage metrics are pulled from the Confluent Metrics API, an API that provides actionable metrics about your Confluent deployment. The Metrics API provides the ability to discover topic or cluster-level metrics programmatically, request metrics values, or post queries to get more granular information. The observability tutorial pulls Confluent Metrics API data via the ccloud-exporter, an open source Go project that queries the Confluent Metrics API endpoints for information about Confluent and presents them in a scrapable format. In the future, Confluent plans to improve the user experience in regard to polling the Metrics API by essentially eliminating the need to run the ccloud-exporter. A sample dashboard built from the Metrics API data can be found in the observability demo configs, or you can simply reference the image below.
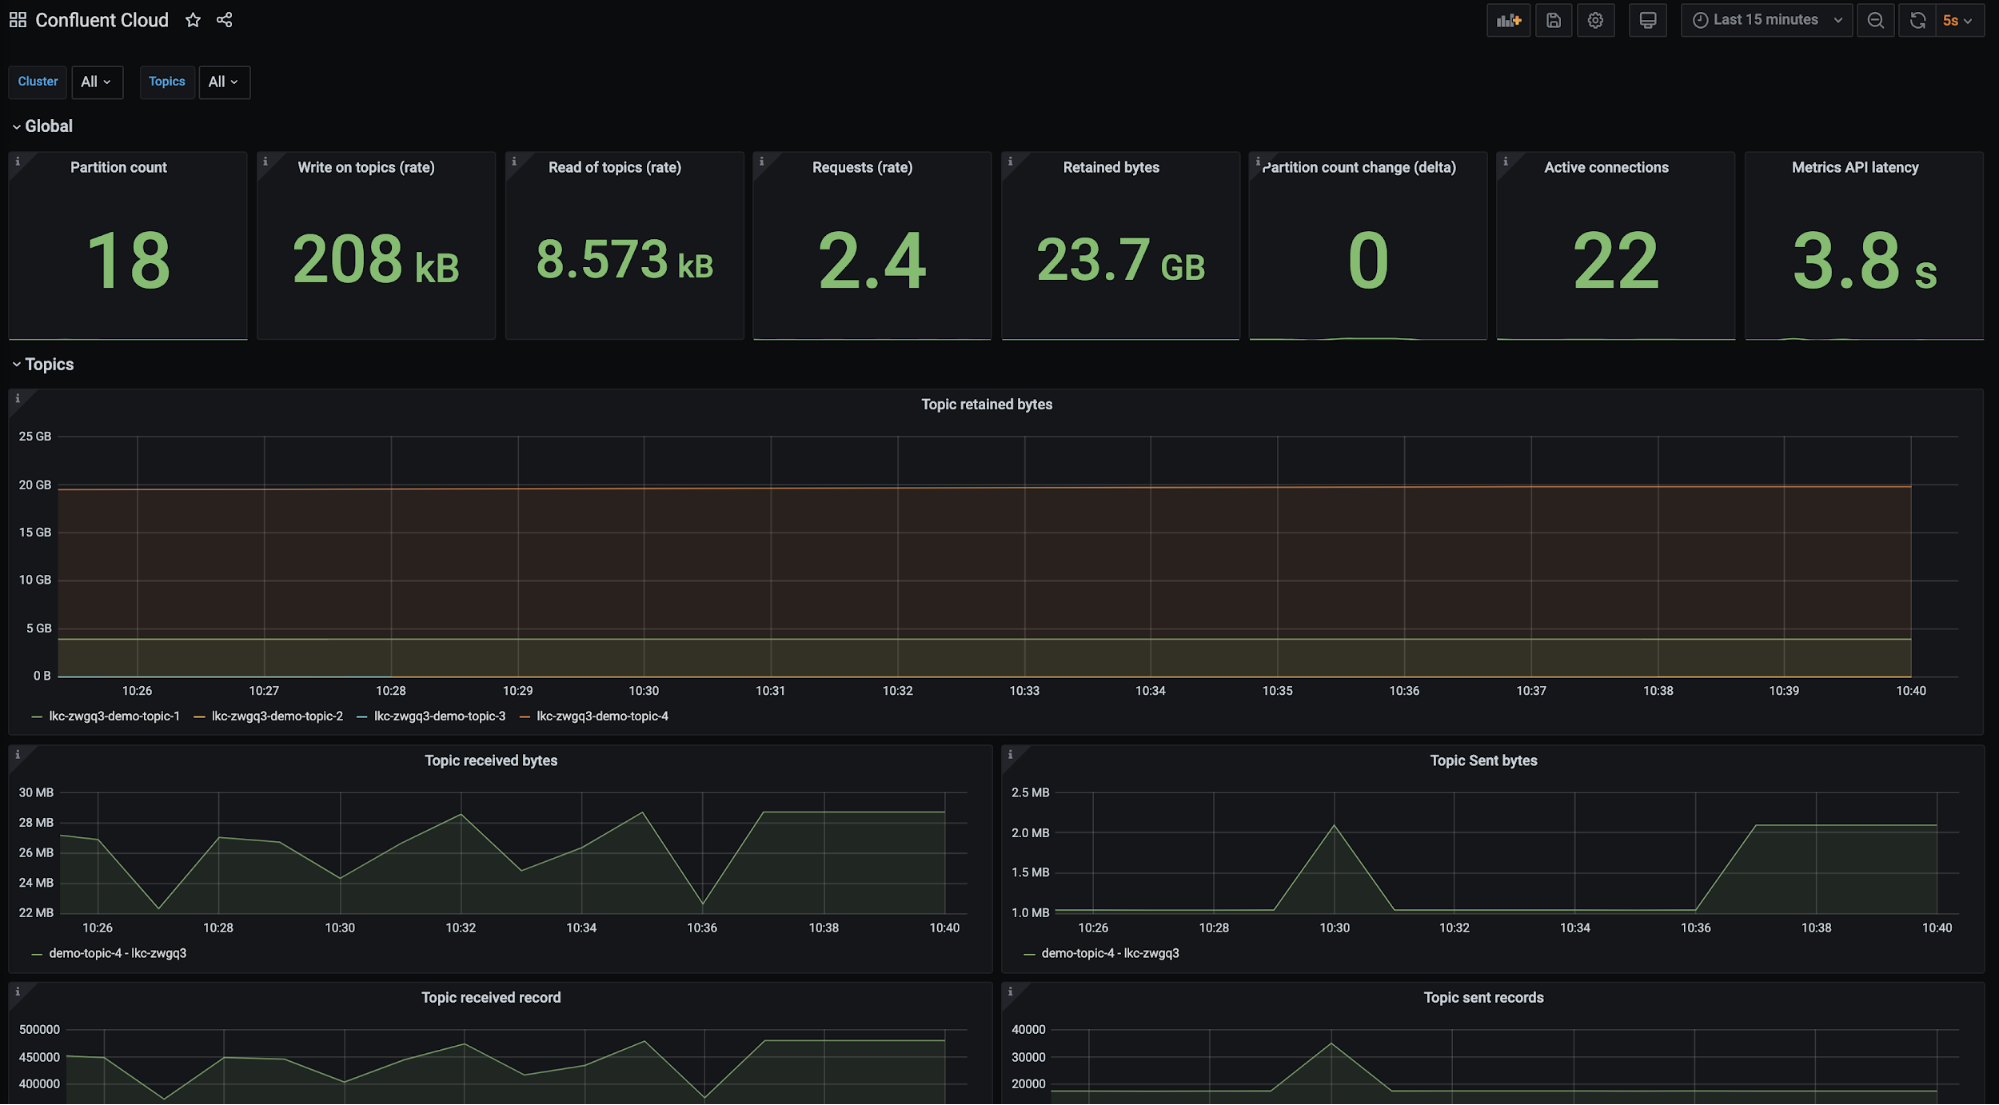
The observability tutorial categorizes client application scenarios as either general, producer, or consumer. Each scenario explicitly distinguishes what metrics are affected. In consumer and producer scenarios, the tutorial instructs you to introduce a failure scenario, takes a look at how the metrics and logs change, and then resolves the failure scenario. Below is a summary of the content in each section.
General client application scenarios
General client application scenarios are situations that any client could run into and are focused on problems that may arise when using a Basic or Standard Confluent cluster.
Failing to create a new partition
It’s possible that you won’t be able to create a partition because you have reached one of Confluent’s partition limits. There are two limits that are important:
- Total partition count before replication
- Total number of partitions created and deleted within a five-minute time period
The scenario mentions that some panels will change colors based on their value. The tutorial is configured in Grafana; however, Datadog and Splunk offer similar threshold functionalities. An example of one of these panels is depicted below.
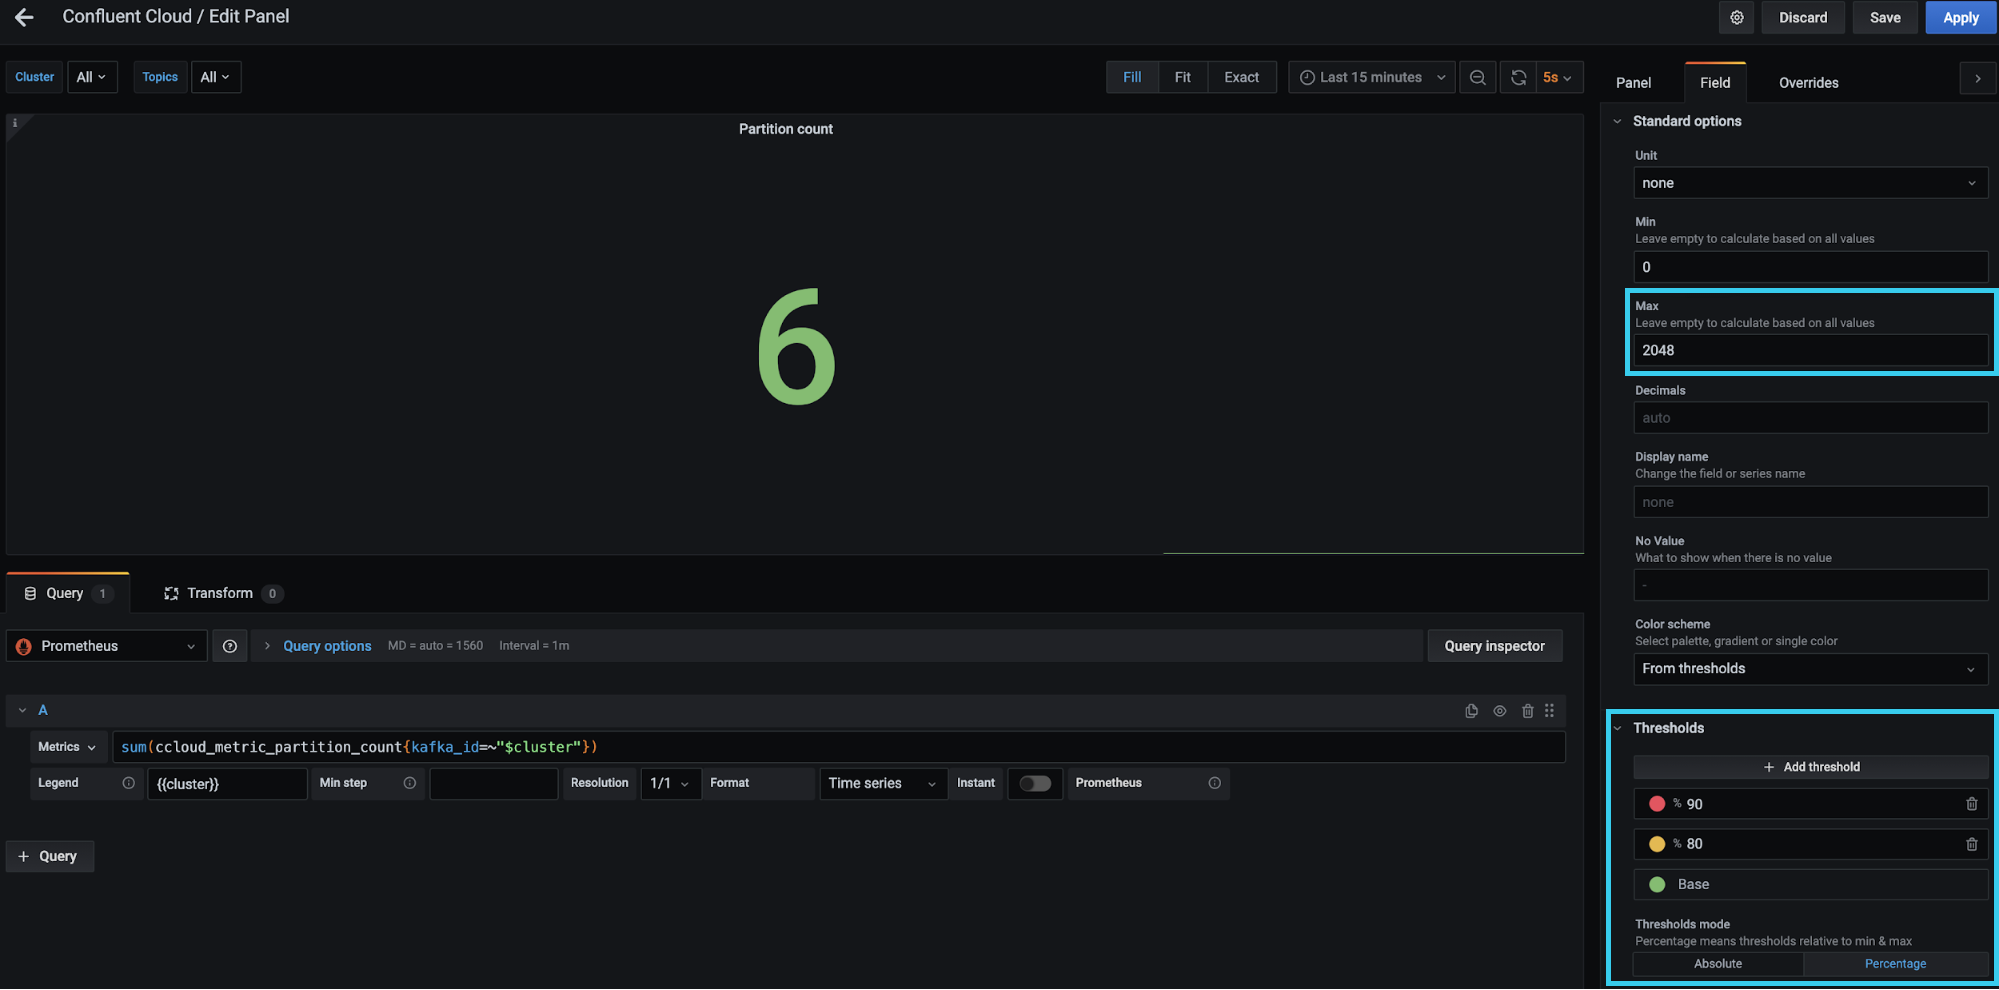
The red box on the top right-hand side specifies the max value as 2,048. Essentially, it is saying the maximum number of partitions for a Basic or Standard cluster is 2,048 or the value of io.confluent.kafka.server/partition_count (from the Metrics API) is 2,048. The red box on the bottom right-hand side is where the thresholds are configured. Notice that a “Percentage” button is toggled on, meaning that the thresholds are defined relative to the maximum. In this case, you can tell Grafana to turn the panel red if the sum of io.confluent.kafka.server/partition_count is equal to or greater than 90% of 2,048 partitions, which you can set based on your desired threshold.
Request rate limits
Confluent limits the maximum number of client requests allowed within a second. Client requests include but are not limited to requests from a producer to send a batch, requests from a consumer to commit an offset, or requests from a consumer to fetch messages. If request rate limits are hit, requests may be refused and clients may be throttled to keep the cluster stable. When a client is throttled, Confluent delays the client’s requests for produce-throttle-time-avg (in ms) for producers or fetch-throttle-time-avg (in ms) for consumers.
Instead of waiting for your client to be throttled, you can proactively measure the number of requests with the Confluent Metrics API metric io.confluent.kafka.server/request_count. The request_count metric provides a count of requests by each type—Produce, Fetch, Heartbeat, and OffsetCommit, to name a few. In order to find the total requests made within a second, you need to calculate the rate of each request and the sum of all the rates. The request rate limits scenario in the observability tutorial references the “Requests (rate)” panel as shown below. The red box highlights how to calculate the sum of the rates in Prometheus.
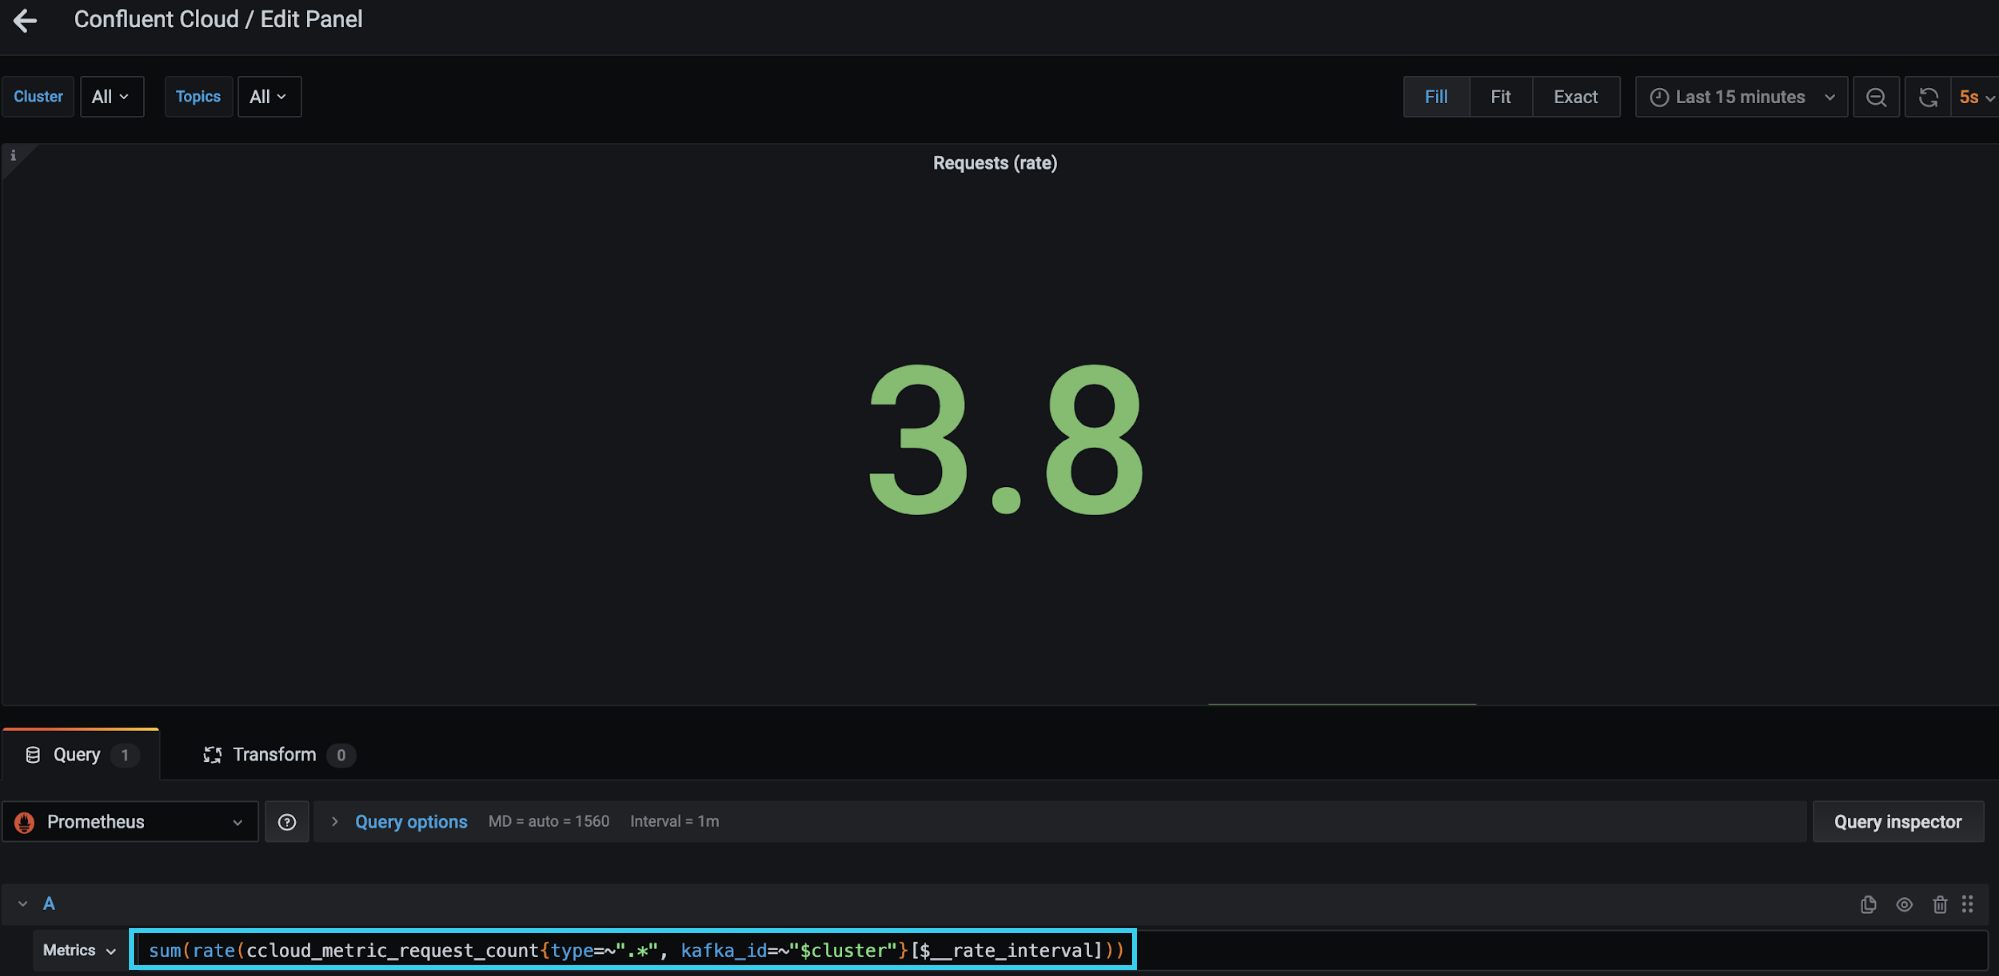
This panel uses similar thresholding as described above, setting the maximum value as 1,500 (the Standard and Basic cluster request rate limit) and changing colors based on percentage used. All thresholding is configurable to suit your needs and cluster type.
It is possible to reduce your request rate by tuning your applications. An example configuration that helps to reduce requests for a producer is linger.ms. This configuration specifies how long to wait before the producer sends a batch of records. The default is 0, meaning the producer won’t wait to batch requests; you might see some batching if the inbound request rate is high enough. Other application optimizations are explained in detail in the Optimizing Your Apache Kafka Deployment white paper.
You can optimize your clients to make fewer requests.
Producer client application scenarios
The dashboard and scenarios in this section use client metrics from a Java producer. As stated earlier, the same principles can be applied to any other non-Java clients. While there are dozens of producer client metrics, a handful can be used to tell if a producer is operating as expected. Those key performance indicators (KPIs) are as follows:
- outgoing-byte-rate: the number of outgoing bytes sent to all servers per second
kafka.producer<type=producer-metrics, client-id=producer-1><>outgoing-byte-rate
- batch-size-avg: the average number of bytes sent per partition per request
kafka.producer<type=producer-metrics, client-id=producer-1><>batch-size-avg
- bufferpool-wait-ratio: the fraction of time that an appender waits for space allocation
kafka.producer<type=producer-metrics, client-id=producer-1><>bufferpool-wait-ratio
- compression-rate-avg: the average compression rate of record batches, defined as the average ratio of the compressed batch size over the uncompressed size
kafka.producer<type=producer-metrics, client-id=producer-1><>compression-rate-avg
- Values closer to 0 indicate higher compression efficiency
- record-queue-time-avg: the average time in ms record batches spent in the send buffer
kafka.producer<type=producer-metrics, client-id=producer-1><>record-queue-time-avg
- request-latency-avg: the average request latency in ms
kafka.producer<type=producer-metrics, client-id=producer-1><>request-latency-avg
- request-rate: the number of requests sent per second
kafka.producer<type=producer-metrics, client-id=producer-1><>request-rate
- producer-throttle-time-avg: the average time in ms that a request was throttled by a broker
kafka.producer<type=producer-metrics, client-id=producer-1><>produce-throttle-time-avg
- record-retry-rate: the average per-second number of retried record sends
kafka.producer<type=producer-metrics, client-id=producer-1><>record-retry-rate
Thresholding and alerting for most of these KPIs is use case dependent. Some applications will have consistent values across the board for these KPIs and deviations from those norms is alarming, while other applications may expect these values to oscillate. Reviewing these KPIs and their alerting thresholds is an important task to complete prior to moving your application to production. Before deciding thresholds, you need to understand the baseline behavior of your application in terms of the KPIs above, then form an opinion about what is abnormal or unacceptable. You also need to tweak these thresholds over time; you may notice some thresholds are too conservative and others create too much noise.
The observability tutorial provides a dashboard with some sample thresholds; however, it is not meant to fit all use cases, nor is it meant for production. Rather, think of it as a learning tool to help you become comfortable with metrics and thresholding. Changes in all of the KPIs may not occur in the following scenarios, but all of the KPIs can be found in Prometheus. The following two scenarios are a small subset of scenarios that could occur when running a client application.
Confluent Cloud unreachable
Running applications in a cloud environment presents numerous challenges, especially configuring network components. If you don’t control your network firewall rules or don’t version-control your configurations, it’s easy to accidentally break client-broker connectivity. This situation is covered in the Confluent Cloud unreachable scenario, simulated by blocking a TCP port used by client-broker communication.
If communication to your broker is blocked, the producer attempts to retry sending a batch, which results in an error when sending. The producer then starts to store its batches in its buffer. This materializes in the metrics: There is an increase in record sends that result in errors (record-error-rate), a bump in record retries (record-retry-rate), a drop in all throughput metrics, and a dip in the amount of buffer memory that is available (buffer-available-bytes). All of this is shown in the dashboard below.
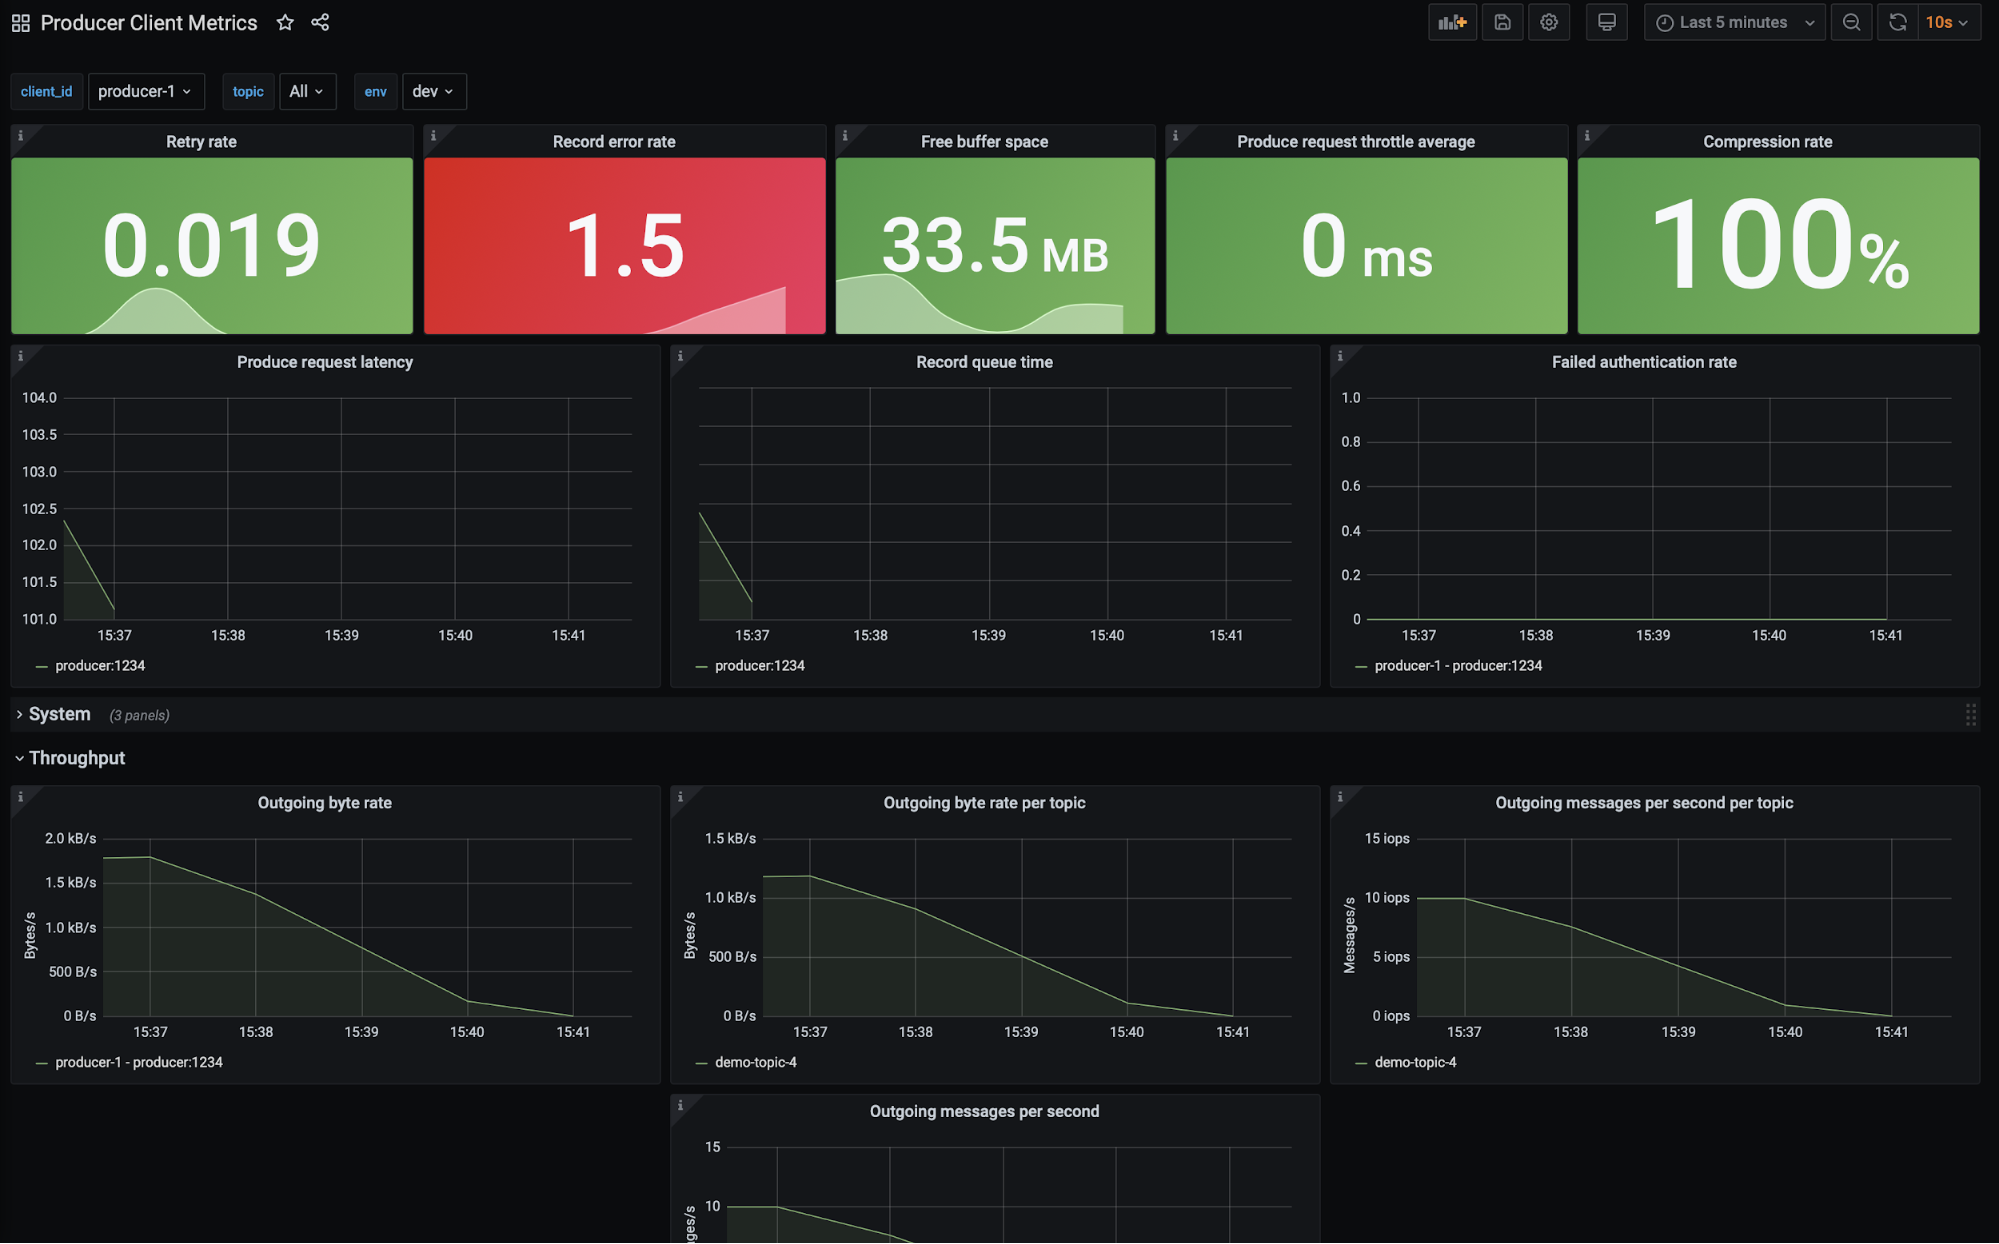
Ultimately, the producer logs inform you that the smoking gun in this situation is a NETWORK_EXCEPTION and that the producer was disconnected from the broker.
Authorization revoked
Diagnosing the scenario where a producer was revoked access to a topic is trickier than you may think, especially if you are only looking at metrics. The application does not check that it is authorized to write to a topic prior to sending a batch of records, thus the application will continue to send records. The throughput of the producer will appear normal and so will most of the other metrics. The only red flag you will see is a steady increase in record sends that result in an error (record-error-rate). Record errors are a sign that something is wrong. Given that’s the only warning on the producer dashboard, you need to move to the Confluent metrics dashboard to get a better understanding of the problem.
The broker will accept the records. In the Confluent metrics, you will see that Confluent receives the bytes/records. After the records are accepted, Confluent then checks if the requests are valid, that is, if the producer is allowed to write to the topic(s). There are a few indications that the requests were not valid and that the records were not written to the cluster. You will notice that the retained bytes (amount of bytes in your cluster) has flattened, meaning no new data is being written. The sent bytes to consumers will drop because there isn’t anything new to read. Yet all of this is not explicit about what is happening with the producer application.
It is not until you look at the logs of the producer that you see there was a TopicAuthorizationException. The reason you are able to see this exception in the producer logs is attributed to a producer callback:
producer.send(new ProducerRecord<String, PageviewRecord>(topic, key, record), new Callback() {
    @Override
    public void onCompletion(RecordMetadata m, Exception e) {
      if (e != null) {
        e.printStackTrace();
      } else {
        System.out.printf("Produced record to topic %s%n", topic);
      }
    }
});
Note that this callback code was developed for a tutorial, so developers should take care when handling exceptions.
Consumer client application scenarios
Similar to the producer section, the dashboard and scenarios in this section use client metrics from a Java consumer. There are a number of consumer metrics, but the following tend to offer the best indication of performance:
- fetch-latency-avg: the average time taken for a fetch request
kafka.consumer<type=consumer-fetch-manager-metrics, client-id=consumer-demo-cloud-observability-1-1><>fetch-latency-avg
- fetch-size-avg: the average number of bytes fetched per request for a topic
kafka.consumer<type=consumer-fetch-manager-metrics, client-id=consumer-demo-cloud-observability-1-1, topic=demo-topic-1><>fetch-size-avg
- fetch-throttle-time-avg: the average throttle time in ms
kafka.consumer<type=consumer-fetch-manager-metrics, client-id=consumer-demo-cloud-observability-1-1><>fetch-throttle-time-avg
- commit-latency-avg: the average time taken for a commit request
kafka.consumer<type=consumer-coordinator-metrics, client-id=consumer-demo-cloud-observability-1-1><>commit-latency-avg
- commit-rate: the number of commit calls per second
kafka.consumer<type=consumer-coordinator-metrics, client-id=consumer-demo-cloud-observability-1-1><>commit-rate
- rebalance-rate-per-hour: the number of successful rebalance events per hour, which should generally be 0; each event is composed of several failed retrials until it succeeds
kafka.consumer<type=consumer-coordinator-metrics, client-id=consumer-demo-cloud-observability-1-1><>rebalance-rate-per-hour
Like the producer KPIs, the normal values of these KPIs are use case dependent. You should monitor your application in a development environment and take note of what the normal behavior is in terms of these KPI values. Once you have a good idea of the KPIs, you can then create thresholds based on your scenario. During the evaluation period, you may learn that latency, fetch size, or some other metrics are not satisfactory; perhaps you need higher throughput, less latency, better durability, or more availability. Now is a great time to optimize your application to meet your goals.
All of the metrics above are captured via Prometheus in the tutorial and presented in Grafana. Again, the observability tutorial provides a consumer client dashboard with sample thresholds. These thresholds may not align with your service goals.
Increasing consumer lag
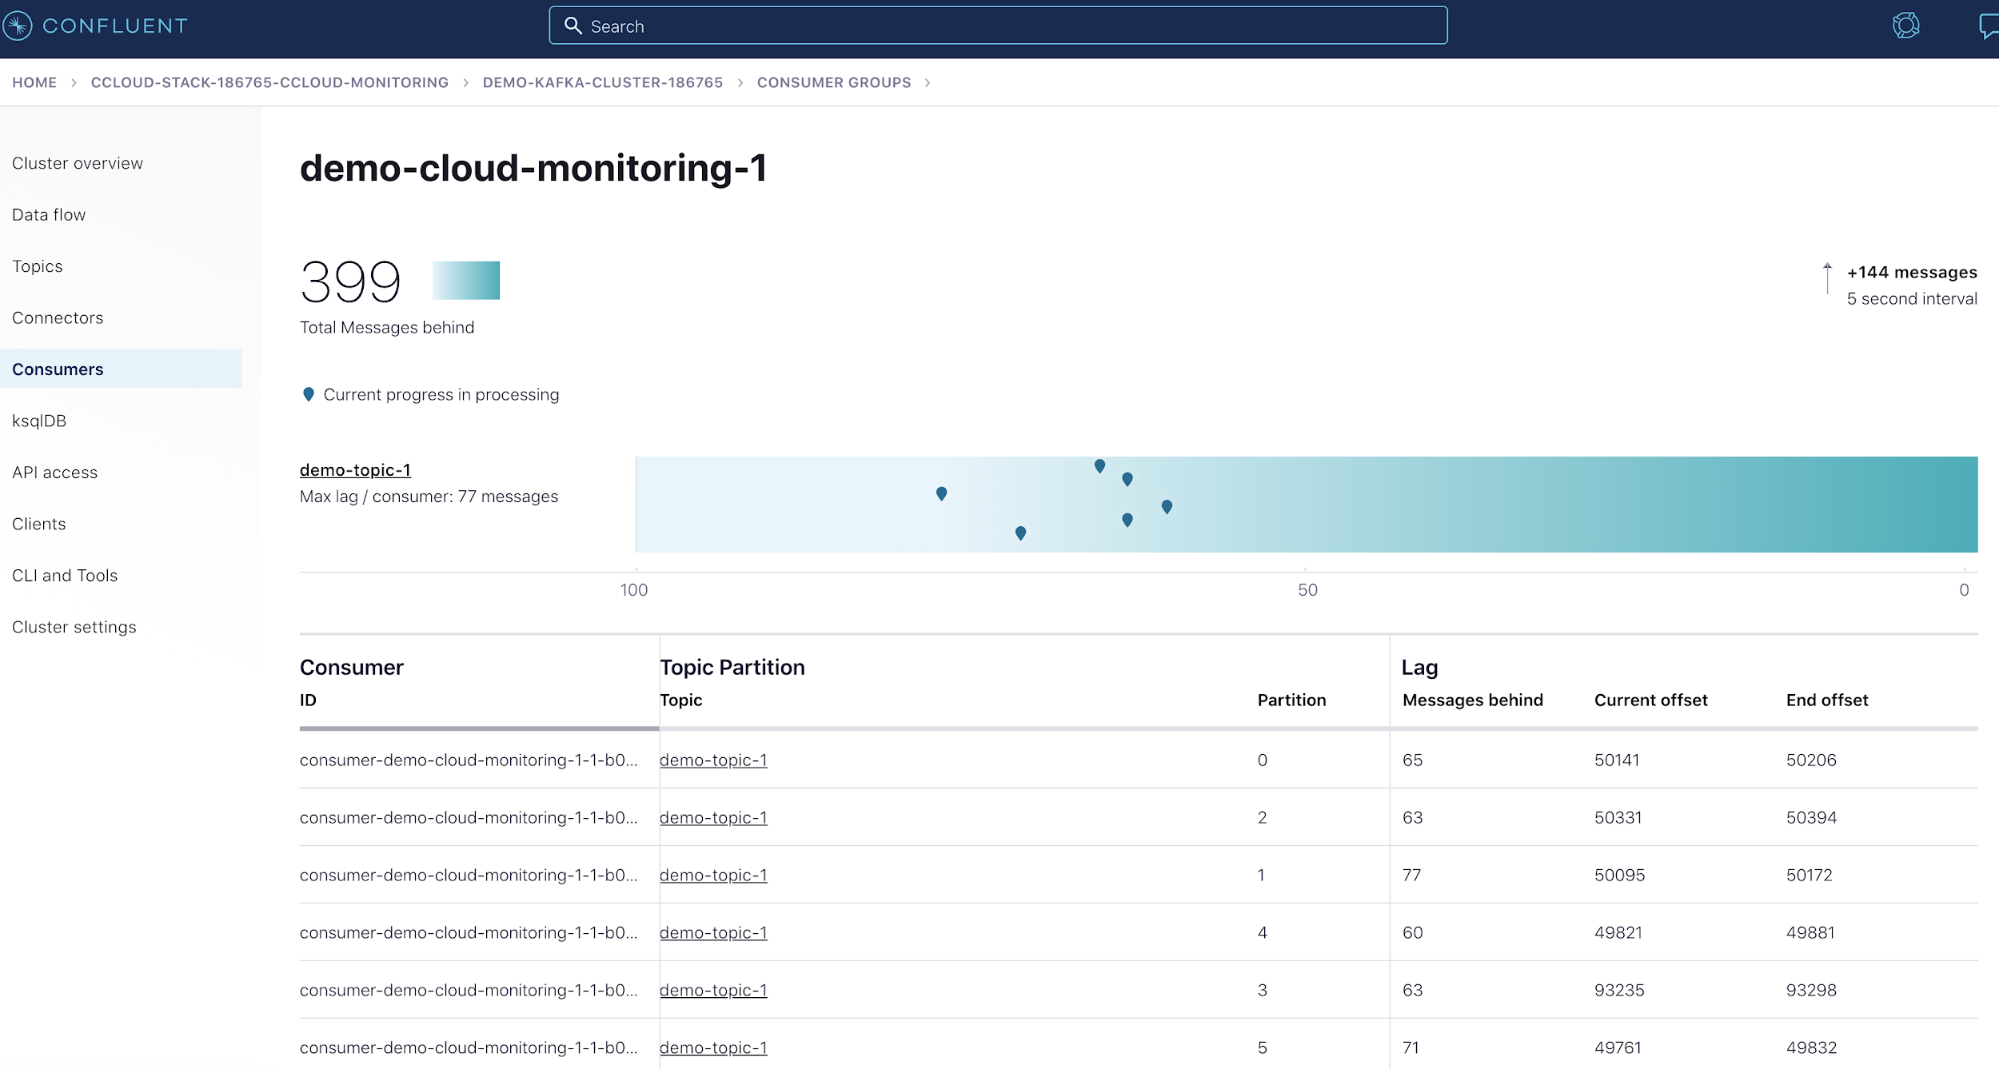
Consumer lag is the offset difference between the producer’s last produced message and the consumer group’s last commit. Some use cases would consider a large increase in consumer lag a degraded state because they have SLAs on the time that it takes to process the latest data.
You can monitor consumer lag using a few different options: kafka-lag-exporter for integration into your time series database and dashboards, the Confluent UI (see image below), or the kafka-consumer-groups CLI command. This scenario walks through all three.
Bonus: Kafka Streams
While this tutorial does not currently reference how to monitor a Kafka Streams application, you can watch Neil Buesing’s “What is the State of my Kafka Streams Application? Unleashing Metrics” talk at Kafka Summit Europe 2021 to learn more. You can also take a sneak peek at the content that his talk covers in the README of kafka-streams-dashboard.
In closing…
It is highly recommended that you revisit the scenarios summarized above and test them out for yourself. If there are any scenarios that you would like to see added to the Observability for Apache Kafka Clients to Confluent Cloud tutorial, please let us know in the Confluent Community Forum. This tutorial aims to help users identify what metrics to monitor and how those metrics may change during incidents, so your input is essential. Monitoring is a crucial part of any project that is moving into production—an operational must-have. The earlier a project has monitoring, the more potential it has to be successful because observability reduces the amount of time spent troubleshooting and helps you make informed decisions in regard to scaling.
Ist dieser Blog-Beitrag interessant? Jetzt teilen
Confluent-Blog abonnieren
New with Confluent Platform 7.9: Oracle XStream CDC Connector, Client-Side Field Level Encryption (EA), Confluent for VS Code, and More
This blog announces the general availability of Confluent Platform 7.9 and its latest key features: Oracle XStream CDC Connector, Client-Side Field Level Encryption (EA), Confluent for VS Code, and more.
Meet the Oracle XStream CDC Source Connector
Confluent's new Oracle XStream CDC Premium Connector delivers enterprise-grade performance with 2-3x throughput improvement over traditional approaches, eliminates costly Oracle GoldenGate licensing requirements, and seamlessly integrates with 120+ connectors...

