[Webinar] AI-Powered Innovation with Confluent & Microsoft Azure | Register Now
Monitoring Apache Kafka with Confluent Control Center Video Tutorials
Mission critical applications built on Kafka need a robust and Kafka-specific monitoring solution that is performant, scalable, durable, highly available, and secure. Confluent Control Center helps monitor your Kafka deployments and provides assurances that your services are behaving properly and meeting SLAs. Control Center was designed for Kafka, by the creators of Kafka, from Day Zero. It provides the most important information to act on so you can address important business-level questions:
- Are my brokers up?
- Are applications receiving all data?
- Are they up to date with the latest events?
- Why are the applications running slowly?
- Do we need to scale out?
You may think Kafka is running fine, but how do you prove it?
Control Center can monitor your Kafka cluster and applications with important monitoring features like System health, End-to-end stream monitoring, and Alerting.
Watch the introductory Confluent Control Center video Monitoring Kafka like a Pro (3:30).
If you are in the early phase of your exploration of Confluent Control Center, you can learn more about what it can do by watching the Confluent Control Center Overview video series:
- Intro | Monitoring Kafka in Confluent Control Center
- Cluster Health | Monitoring Kafka in Confluent Control Center
- End-to-End Message Delivery | Monitoring Kafka in Confluent Control Center
- Optimizing Performance | Monitoring Kafka in Confluent Control Center
- Real-world Scenario | Monitoring Kafka in Confluent Control Center
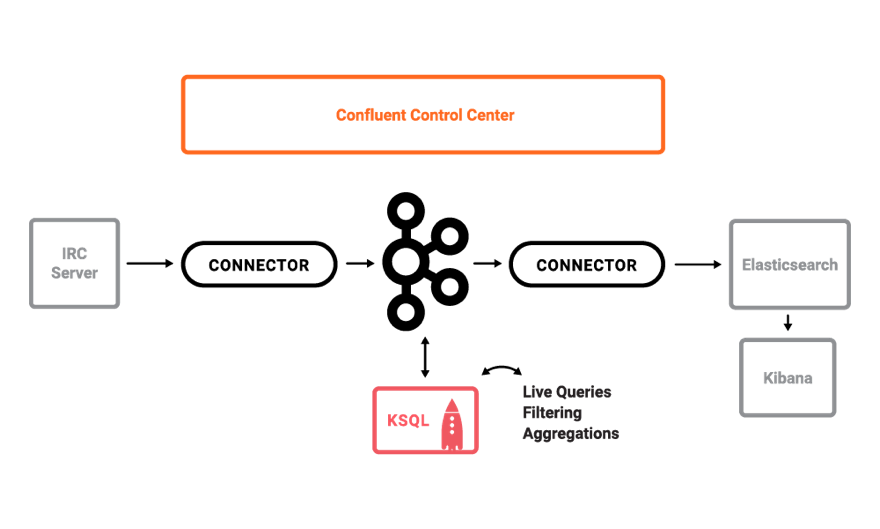
If you are ready to get hands on, check out our Confluent Platform Demo GitHub repo. Following the realistic scenario in this repo, which takes just a few seconds to spin up, you will use Control Center to monitor a Kafka cluster and then walk through a playbook of various operational events. The use case is as follows:
A streaming ETL pipeline built around live edits to real Wikipedia pages. The Wikimedia Foundation has IRC channels that publish edits happening to real wiki pages in real time. Using Kafka Connect, a Kafka source connector kafka-connect-irc streams raw messages from these IRC channels, and a custom Kafka Connect transform kafka-connect-transform-wikiedit transforms these messages and then the messages are written to Kafka. This demo uses KSQL for data enrichment, or you can optionally develop and run your own Kafka Streams application. Then a Kafka sink connector kafka-connect-elasticsearch streams the data out of Kafka, and the data is materialized into Elasticsearch for analysis by Kibana.

The cp-demo repo comes with a playbook for operational events and corresponding video tutorials of useful scenarios to run through with Control Center:
You can also download the Confluent Platform and bring up your own cluster and Confluent Control Center locally with the quickstart.
Ist dieser Blog-Beitrag interessant? Jetzt teilen
Confluent-Blog abonnieren
New with Confluent Platform 7.9: Oracle XStream CDC Connector, Client-Side Field Level Encryption (EA), Confluent for VS Code, and More
This blog announces the general availability of Confluent Platform 7.9 and its latest key features: Oracle XStream CDC Connector, Client-Side Field Level Encryption (EA), Confluent for VS Code, and more.
Meet the Oracle XStream CDC Source Connector
Confluent's new Oracle XStream CDC Premium Connector delivers enterprise-grade performance with 2-3x throughput improvement over traditional approaches, eliminates costly Oracle GoldenGate licensing requirements, and seamlessly integrates with 120+ connectors...

