[Virtual Event] GenAI Streamposium: Learn to Build & Scale Real-Time GenAI Apps | Register Now
How to Run Confluent on Windows in Minutes
I previously showed how to install and set up Apache Kafka® on Windows in minutes by using the Windows Subsystem for Linux 2 (WSL 2). From there, it’s only a few minutes more to spin up the whole Confluent stack, which gives you access to a richer ecosystem of components—like ksqlDB, Schema Registry, the REST Proxy, and Control Center—all running on Windows. Although running Confluent on Windows isn’t supported for production, it’s totally suitable for developing your event streaming applications.
Now you’ll take the next step: install Confluent and then use Confluent Control Center to set up a connector that produces example streaming data to a Kafka topic. Then you’ll create a stream that you can query with SQL statements in ksqlDB, and finally, you’ll monitor the stream’s consumer group for performance.
Set up your environment
Install Windows Subsystem for Linux 2
You need Windows 10 and the Windows Subsystem for Linux 2 (WSL 2), so follow the steps to run Apache Kafka on Windows if you haven’t already. On Windows, you have a number of choices for your Linux distribution; this post uses Ubuntu 20.04.
Download the Confluent package
You have the following options for installing Confluent on your development machine:
They’re all quick and easy, but in this post, we’ll use the TAR file.
Open a Linux terminal and run the following command to download the TAR file for Confluent Platform 6.1 (for the latest version, see the documentation for a manual install using ZIP and TAR archives):
wget https://packages.confluent.io/archive/6.1/confluent-6.1.0.tar.gz
When the download completes, run the following command to extract the files from the archive:
tar -xvf confluent-6.1.0.tar.gz
For more information about installing Confluent Platform, see the On-Premises Deployments documentation.
Set the CONFLUENT_HOME environment variable
The previous tar command creates the confluent-6.1.0 directory. Set the CONFLUENT_HOME environment variable to this directory and add it to your PATH:
export CONFLUENT_HOME=~/confluent-6.1.0
export PATH=$CONFLUENT_HOME/bin:$PATH
This enables tools like the Confluent CLI and confluent-hub to work with your installation.
Install the Datagen connector
Streaming events are the lifeblood of Kafka, and one of the easiest ways to produce mock events to your cluster is to use the Datagen Source Connector. Run the following command to get it from the Confluent Hub:
confluent-hub install --no-prompt confluentinc/kafka-connect-datagen:latest
Your output should resemble the following:
Running in a "--no-prompt" mode Implicit acceptance of the license below: Apache License 2.0 https://www.apache.org/licenses/LICENSE-2.0 Downloading component Kafka Connect Datagen 0.4.0, provided by Confluent, Inc. from Confluent Hub and installing into /home/jim/confluent-6.1.0/share/confluent-hub-components Adding installation directory to plugin path in the following files: /home/jim/confluent-6.1.0/etc/kafka/connect-distributed.properties /home/jim/confluent-6.1.0/etc/kafka/connect-standalone.properties /home/jim/confluent-6.1.0/etc/schema-registry/connect-avro-distributed.properties /home/jim/confluent-6.1.0/etc/schema-registry/connect-avro-standalone.propertiesCompleted
Your installation is complete! Now you can run Confluent on Windows and stream data to your local Kafka cluster.
Start the Confluent components
You could start each of the Confluent components individually by running the scripts in the $CONFLUENT_HOME/bin directory, but we recommend that you use the CLI instead as it’s much easier.
Run the following command to start up all of the Confluent components:
confluent local services start
Your output should resemble the following:
The local commands are intended for a single-node development environment only, NOT for production usage. https://docs.confluent.io/current/cli/index.htmlUsing CONFLUENT_CURRENT: /tmp/confluent.485994 Starting ZooKeeper ZooKeeper is [UP] Starting Kafka Kafka is [UP] Starting Schema Registry Schema Registry is [UP] Starting Kafka REST Kafka REST is [UP] Connect is [UP] ksqlDB Server is [UP] Control Center is [UP]
With a single command, you have the whole Confluent Platform up and running.
While starting Confluent components, you may get an error similar to this:
Starting Connect
Error: Connect failed to start
Try running the confluent local services start command again. If it still doesn’t work, use confluent local log connect to investigate the cause of the error.
Use Confluent Control Center to view your cluster
To inspect and manage your cluster, open a web browser to http://localhost:9021/. You’ll see the “Clusters” page, which shows your running Kafka cluster and the attached Kafka Connect and ksqlDB clusters.
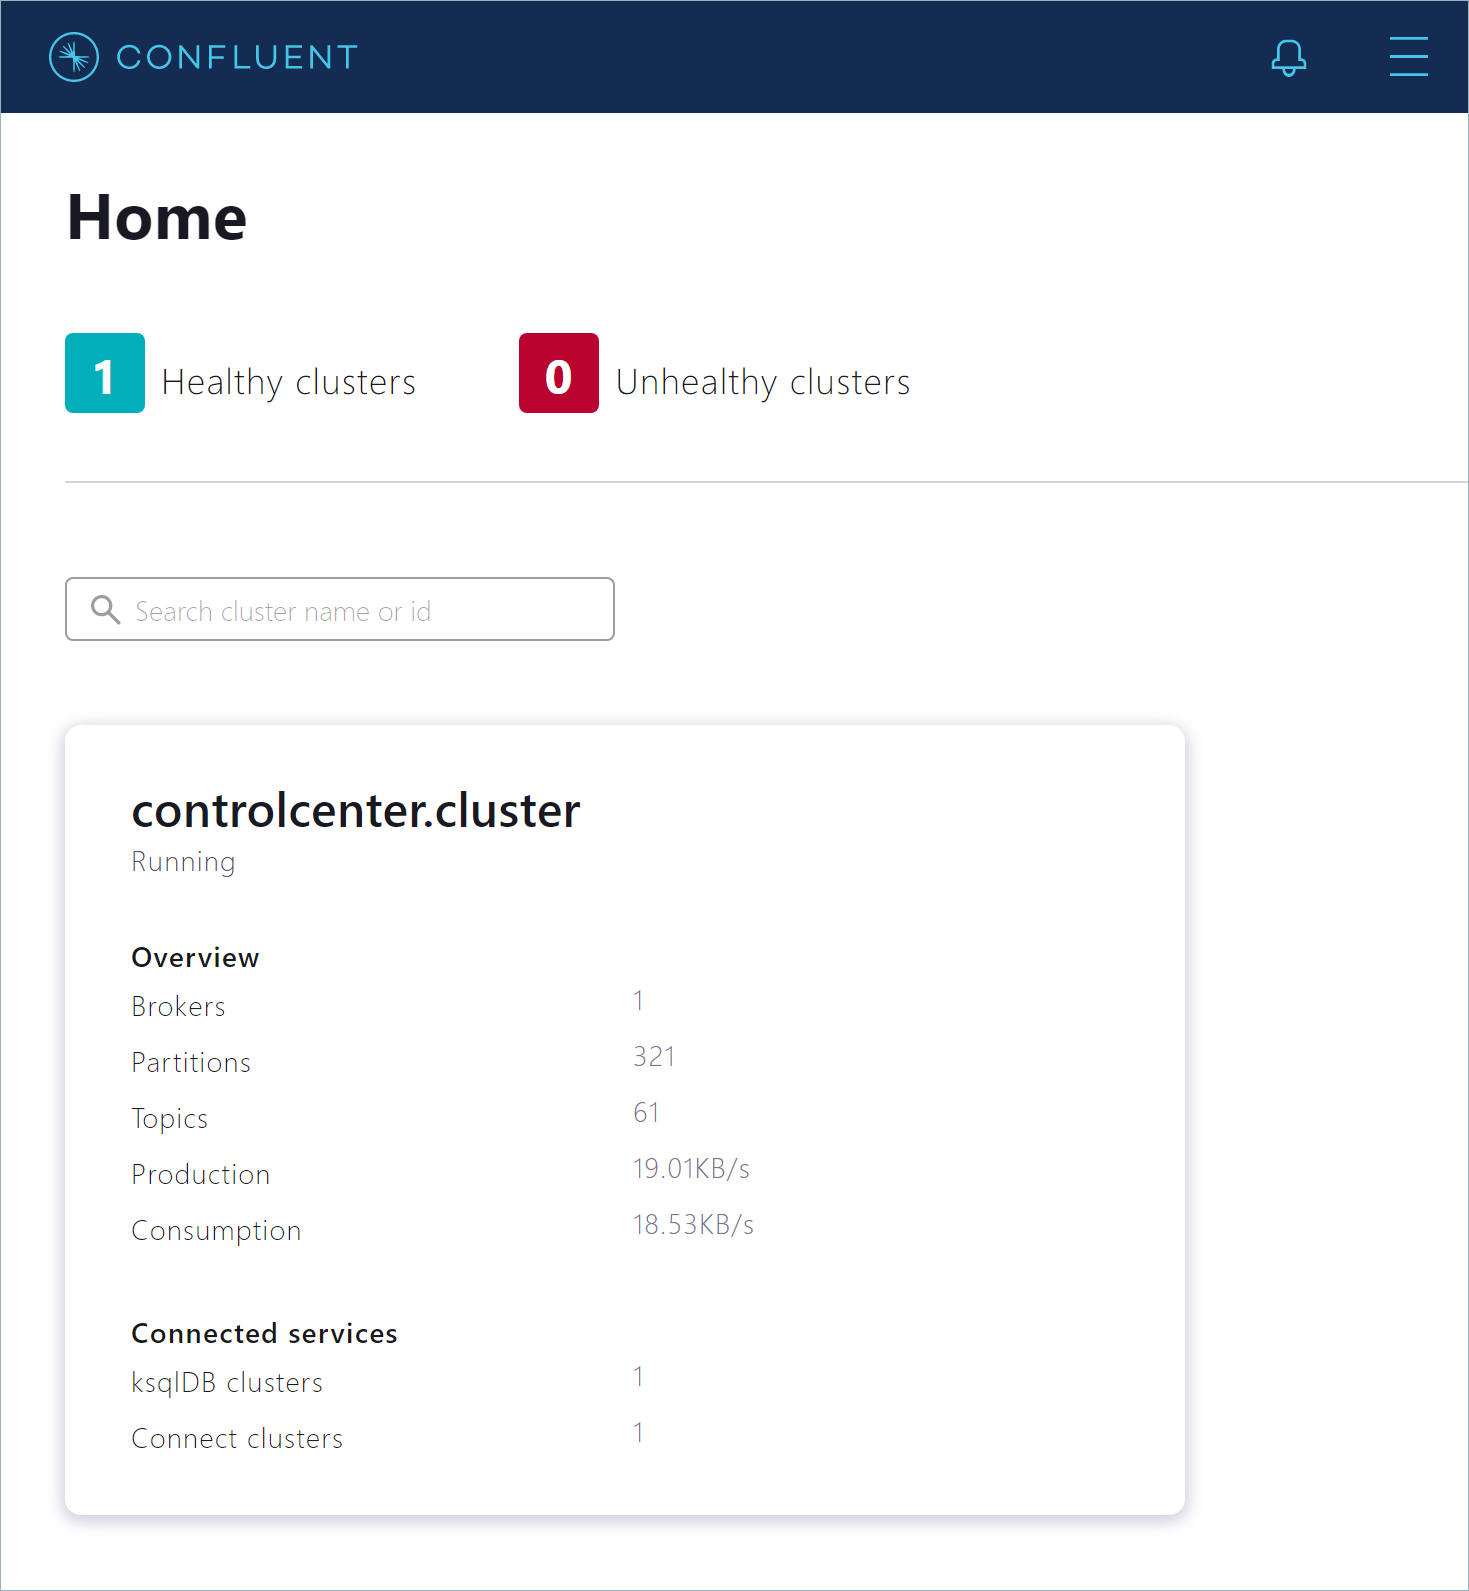
Click the controlcenter.cluster tile to inspect your local installation. The “Cluster Overview” page opens. This page shows vital metrics, like production and consumption rates, out-of-sync replicas, and under-replicated partitions.
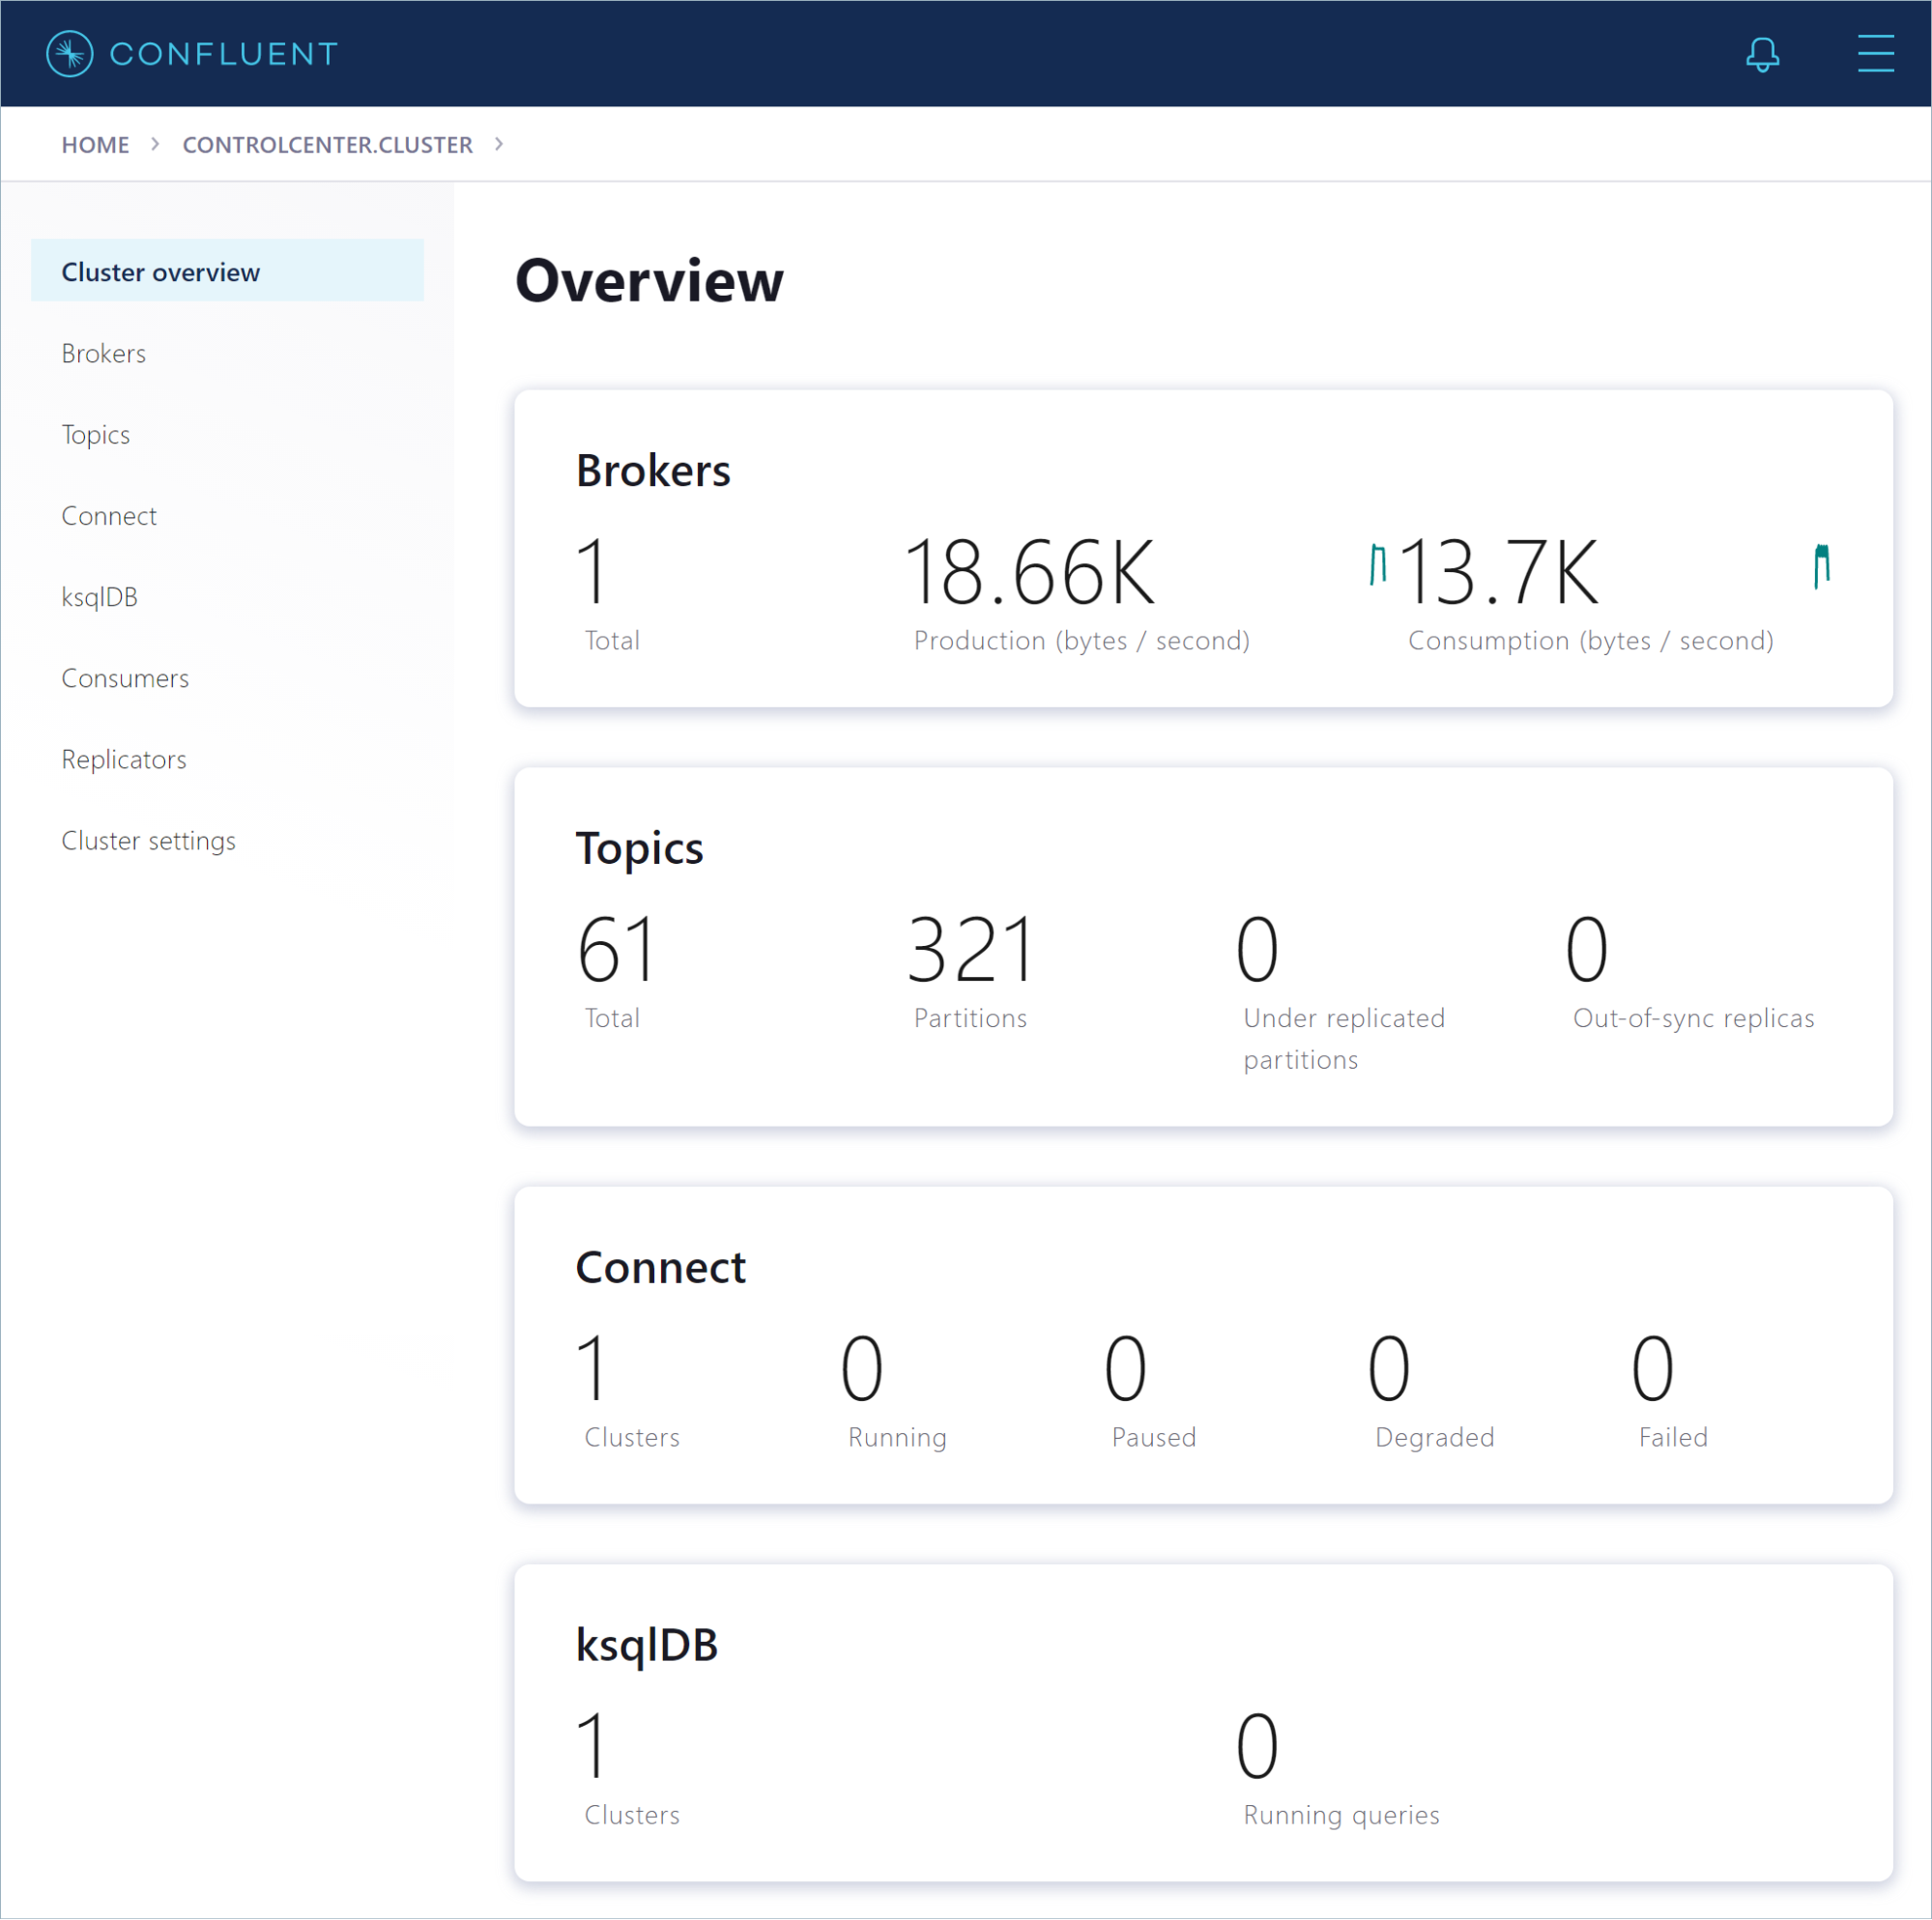
From the navigation menu in the left pane, you can view various parts of your Confluent installation.
Produce data to a Kafka topic
Click Connect to start producing example messages. On the “Connect Clusters” page, click connect-default. You don’t have any connectors running yet, so click Add connector. The “Browse” page opens.
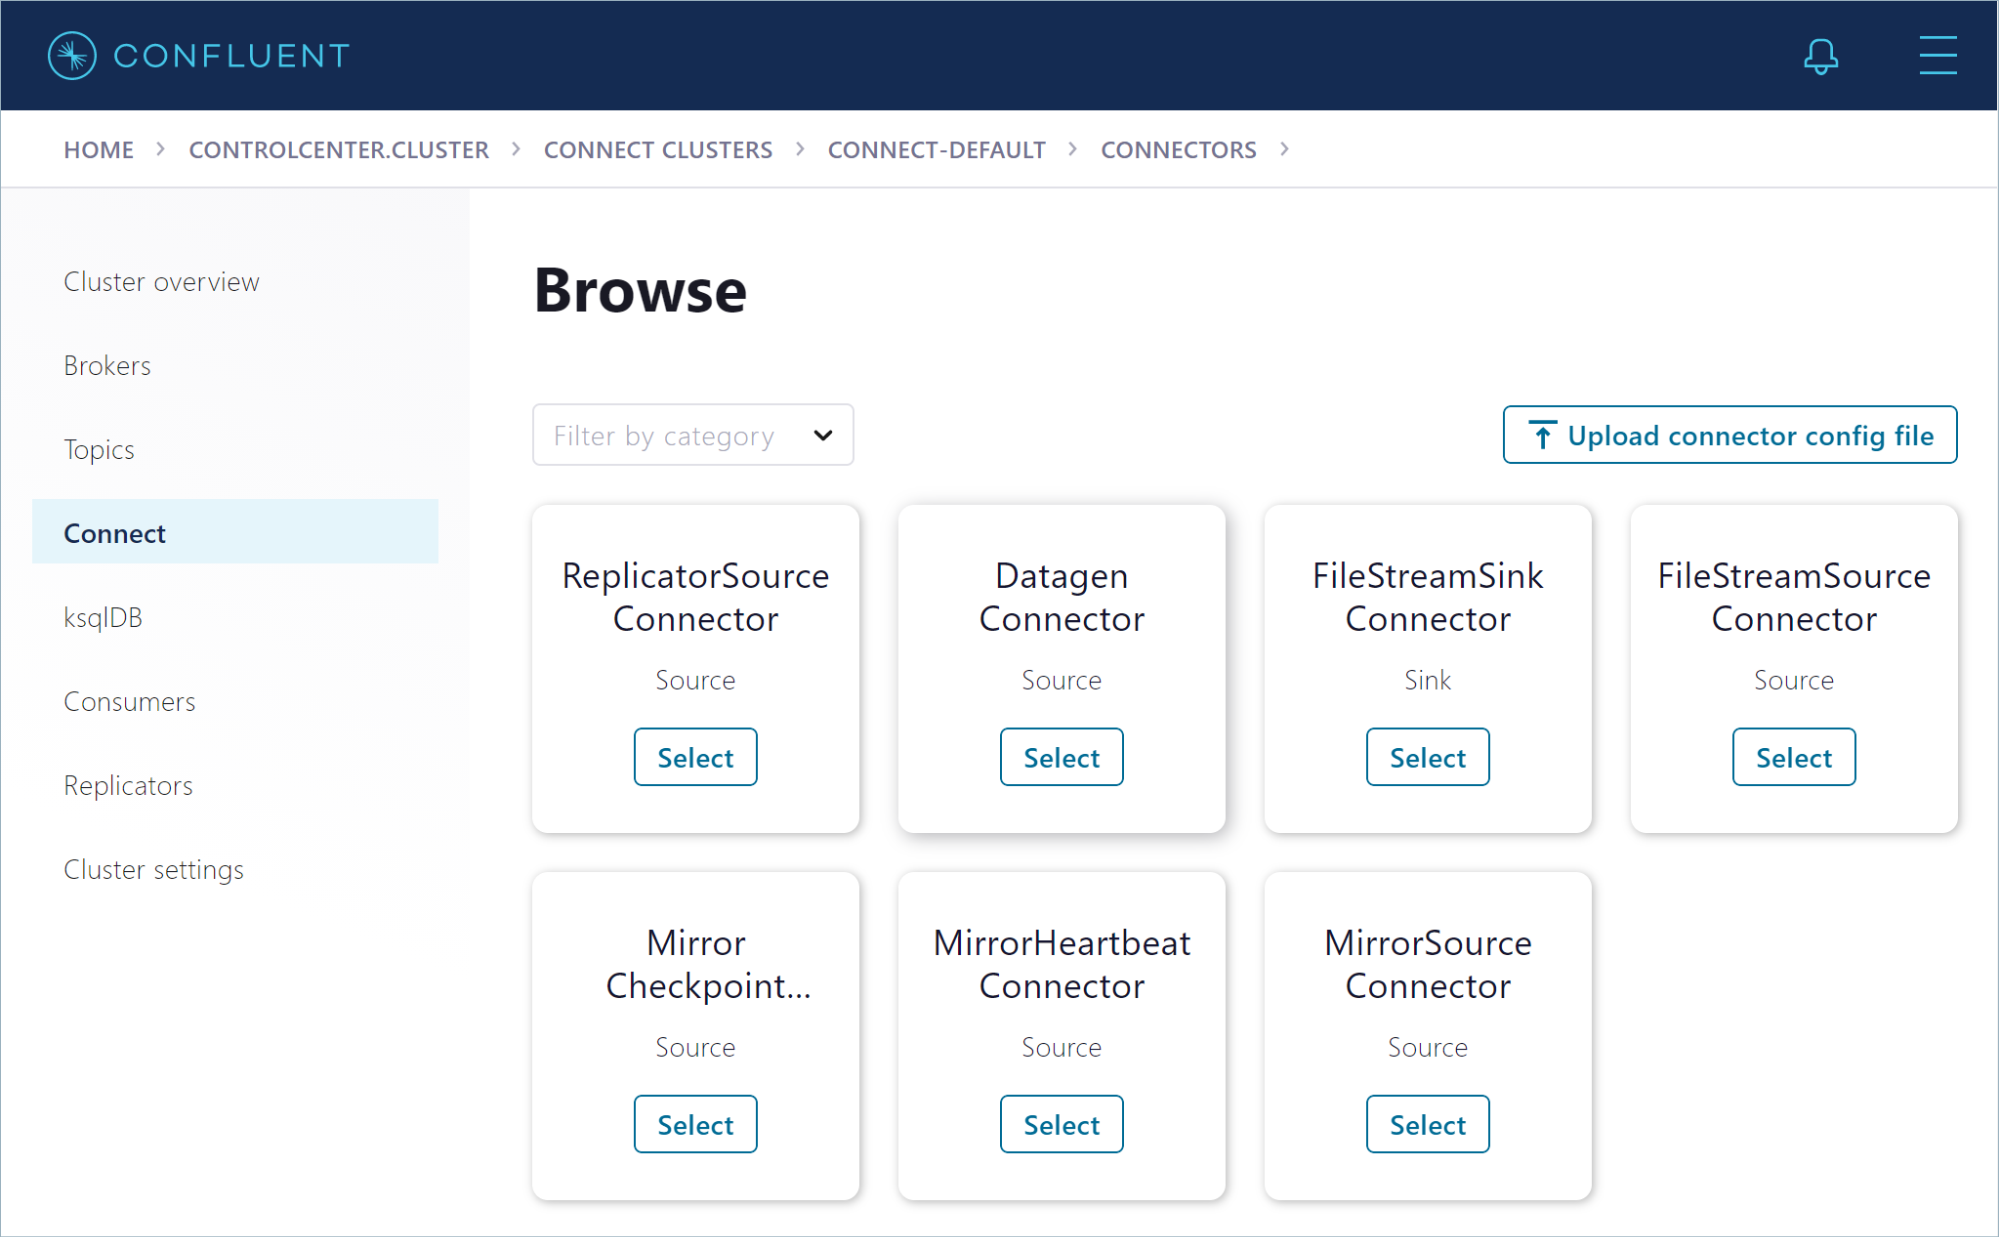
Click the Datagen Connector tile. On the configuration page, set up the connector to produce page view events to a new pageviews topic in your cluster.
- In the “Name” field, enter datagen-pageviews as the name of the connector
- Enter the following configuration values:
- Key converter class: org.apache.kafka.connect.storage.StringConverter
- Kafka.topic: pageviews
- max.interval: 100
- quickstart: pageviews
- Click Continue
- Review the connector configuration and click Launch
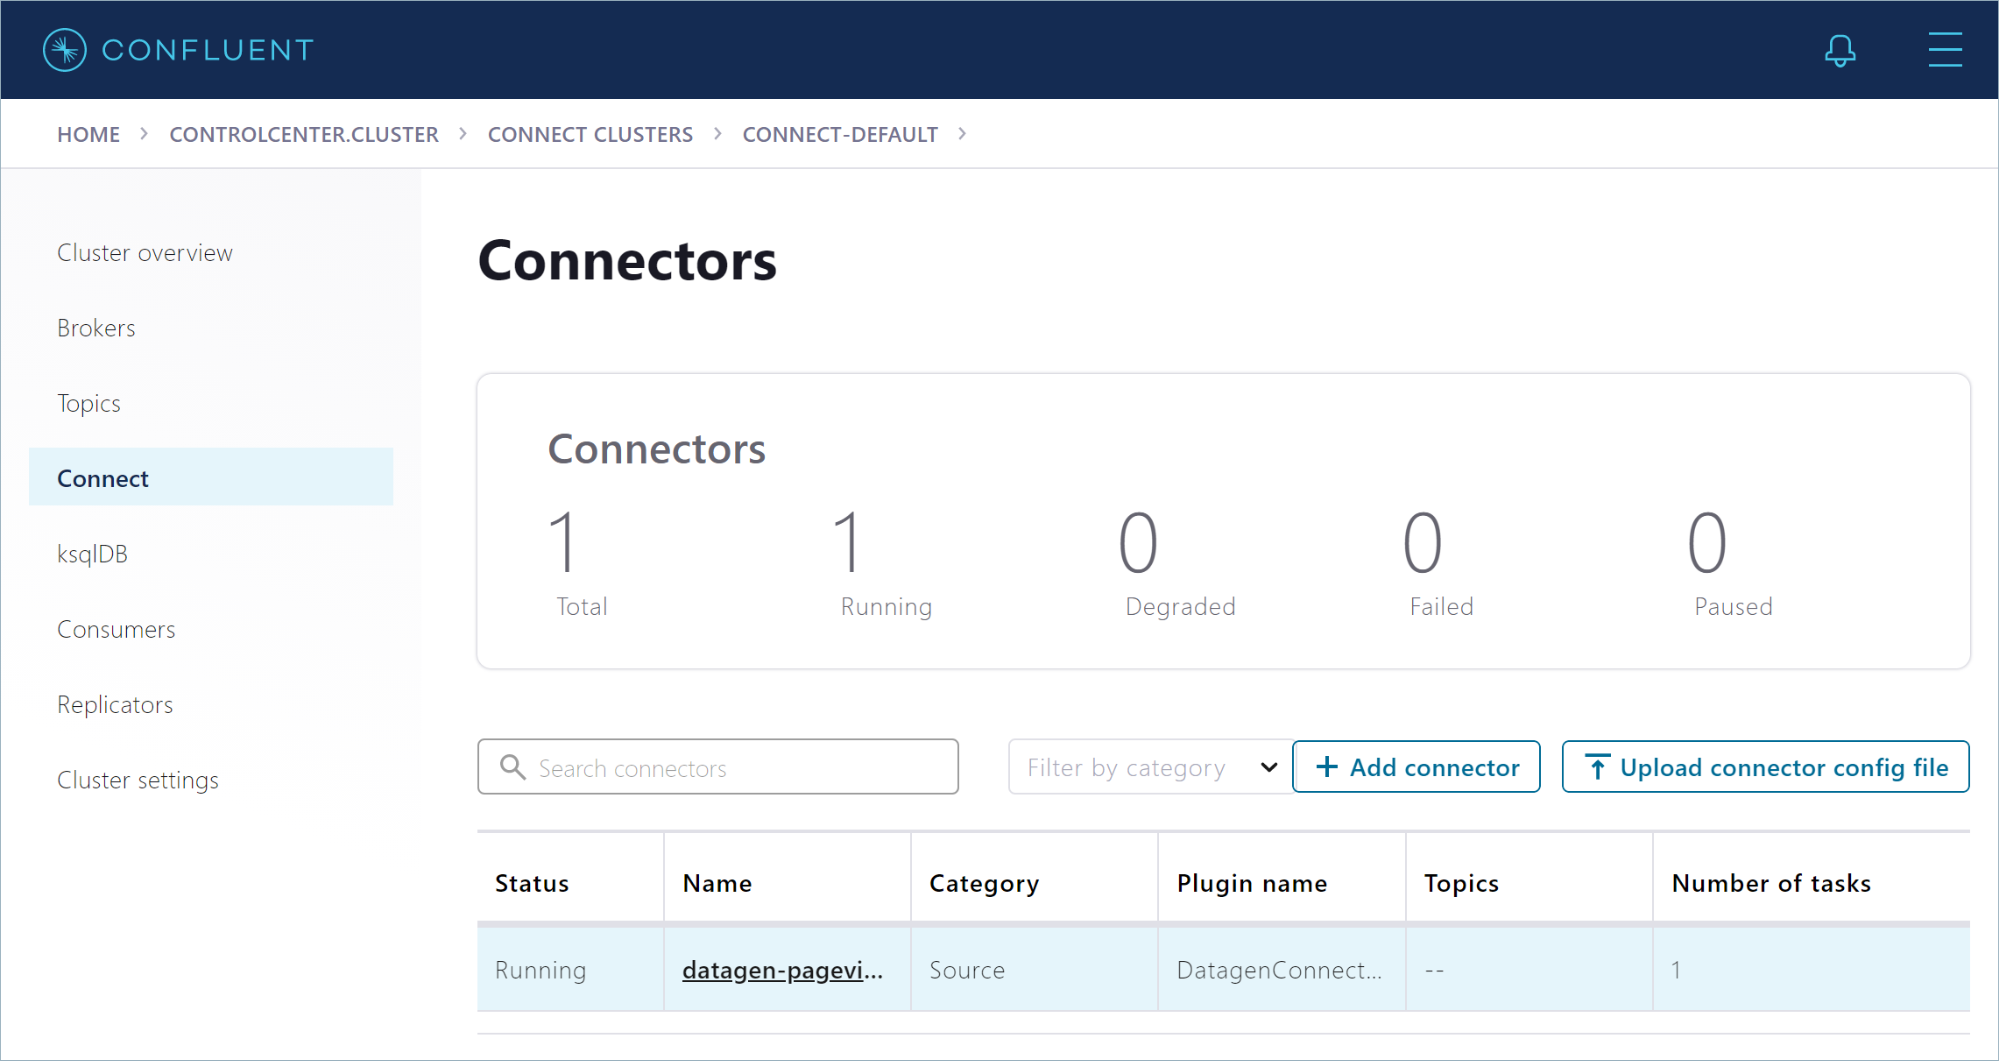
After you create the datagen-pageviews connector, Control Center shows it running on the “Connectors” page.
The Datagen connector creates the pageviews topic for you. In the navigation menu, click Topics, and in the topics list, click pageviews. The overview shows metrics for the topic, including the production rate and the current size on disk.
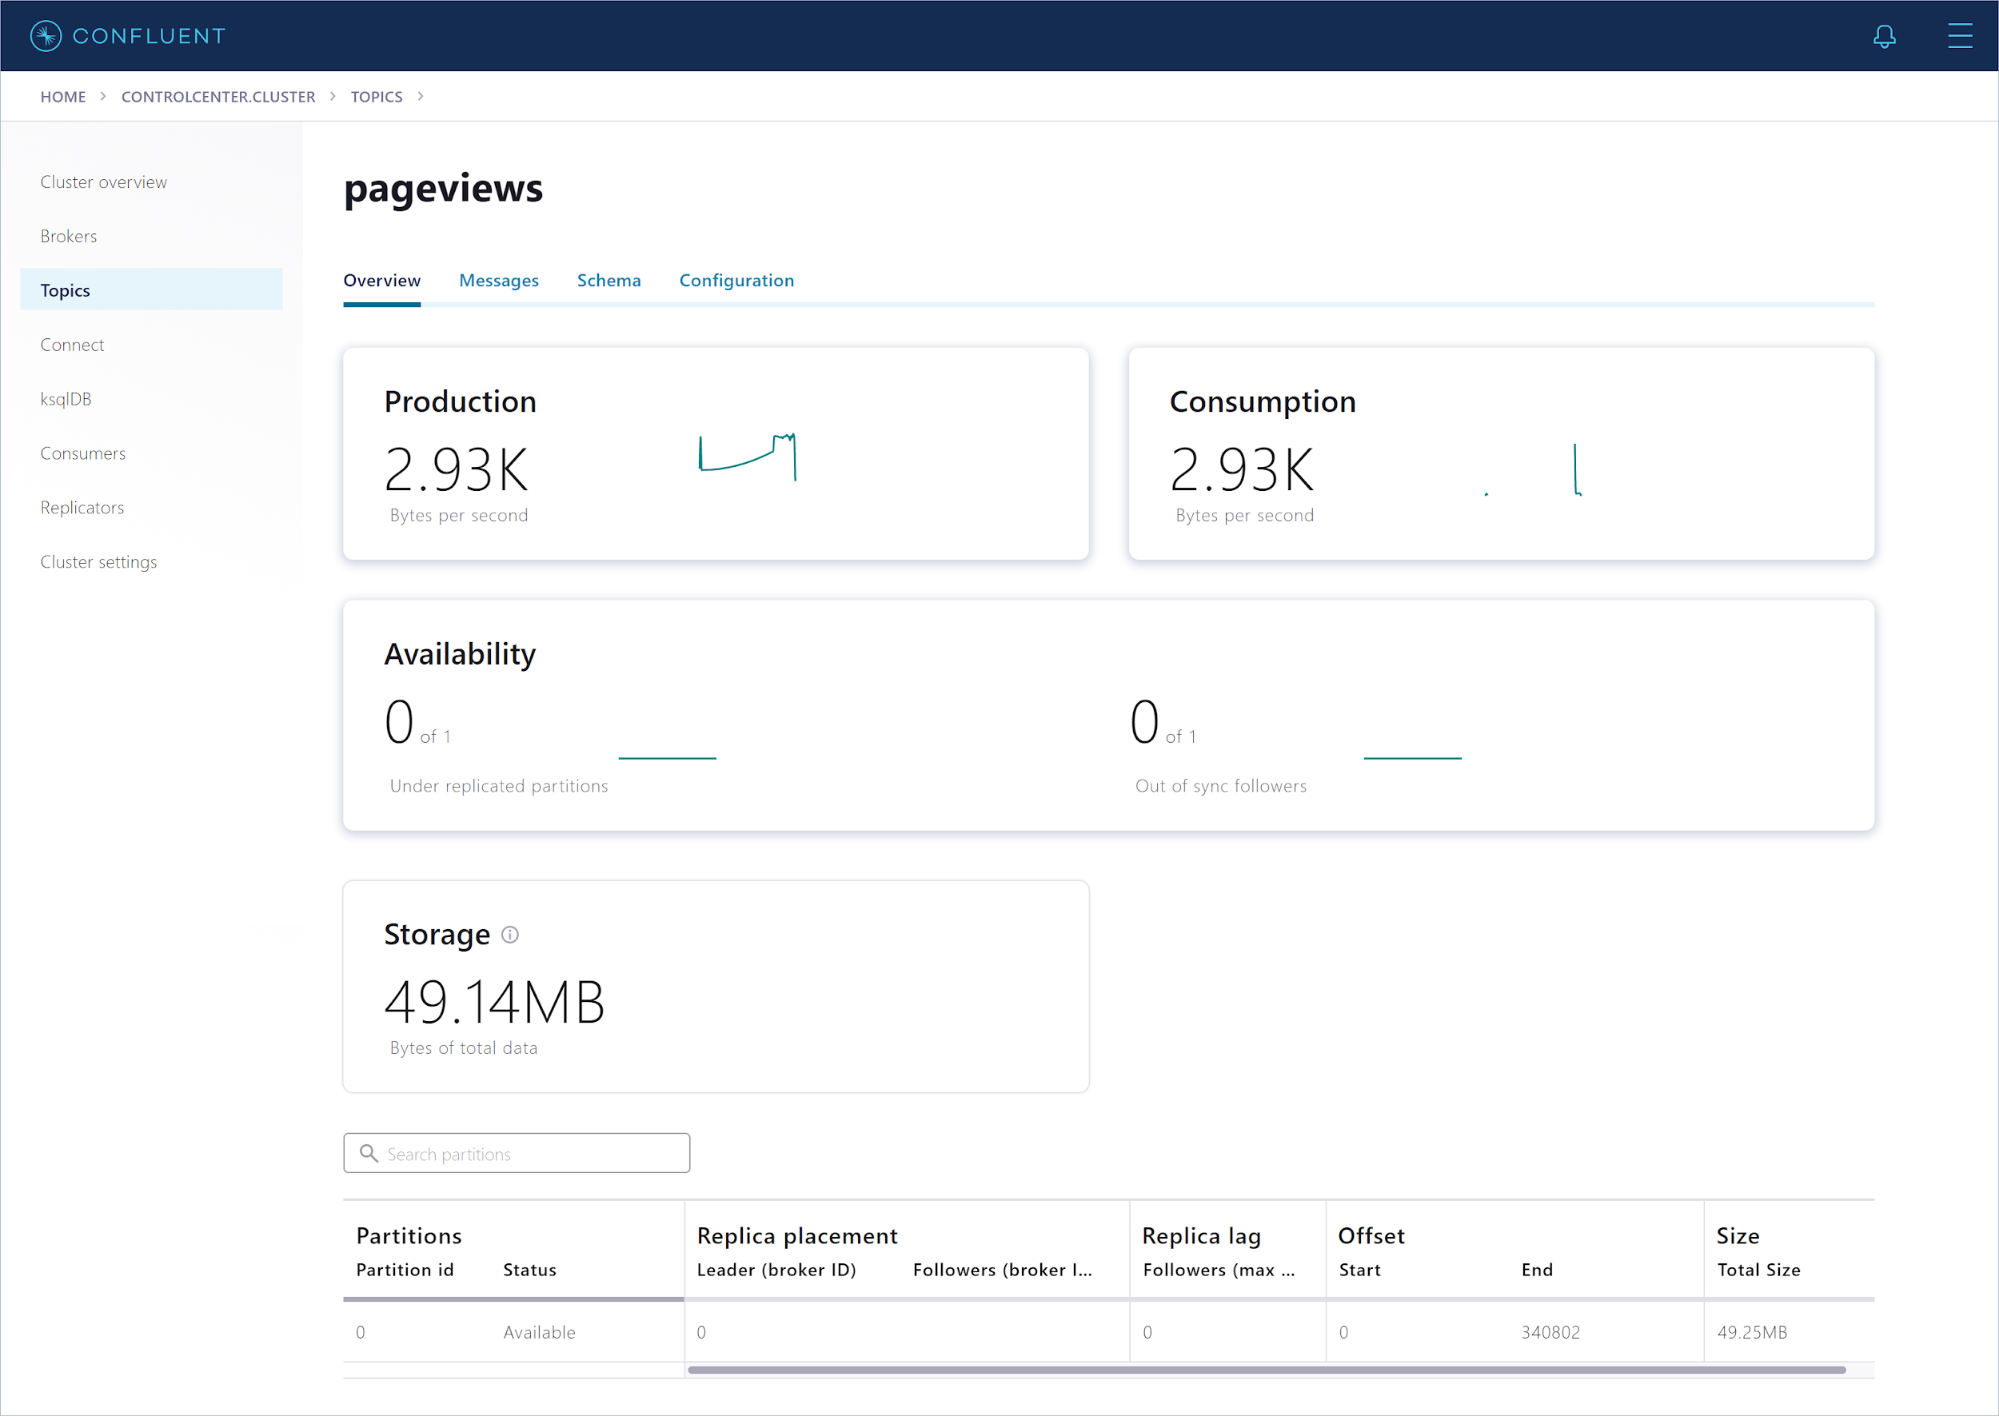
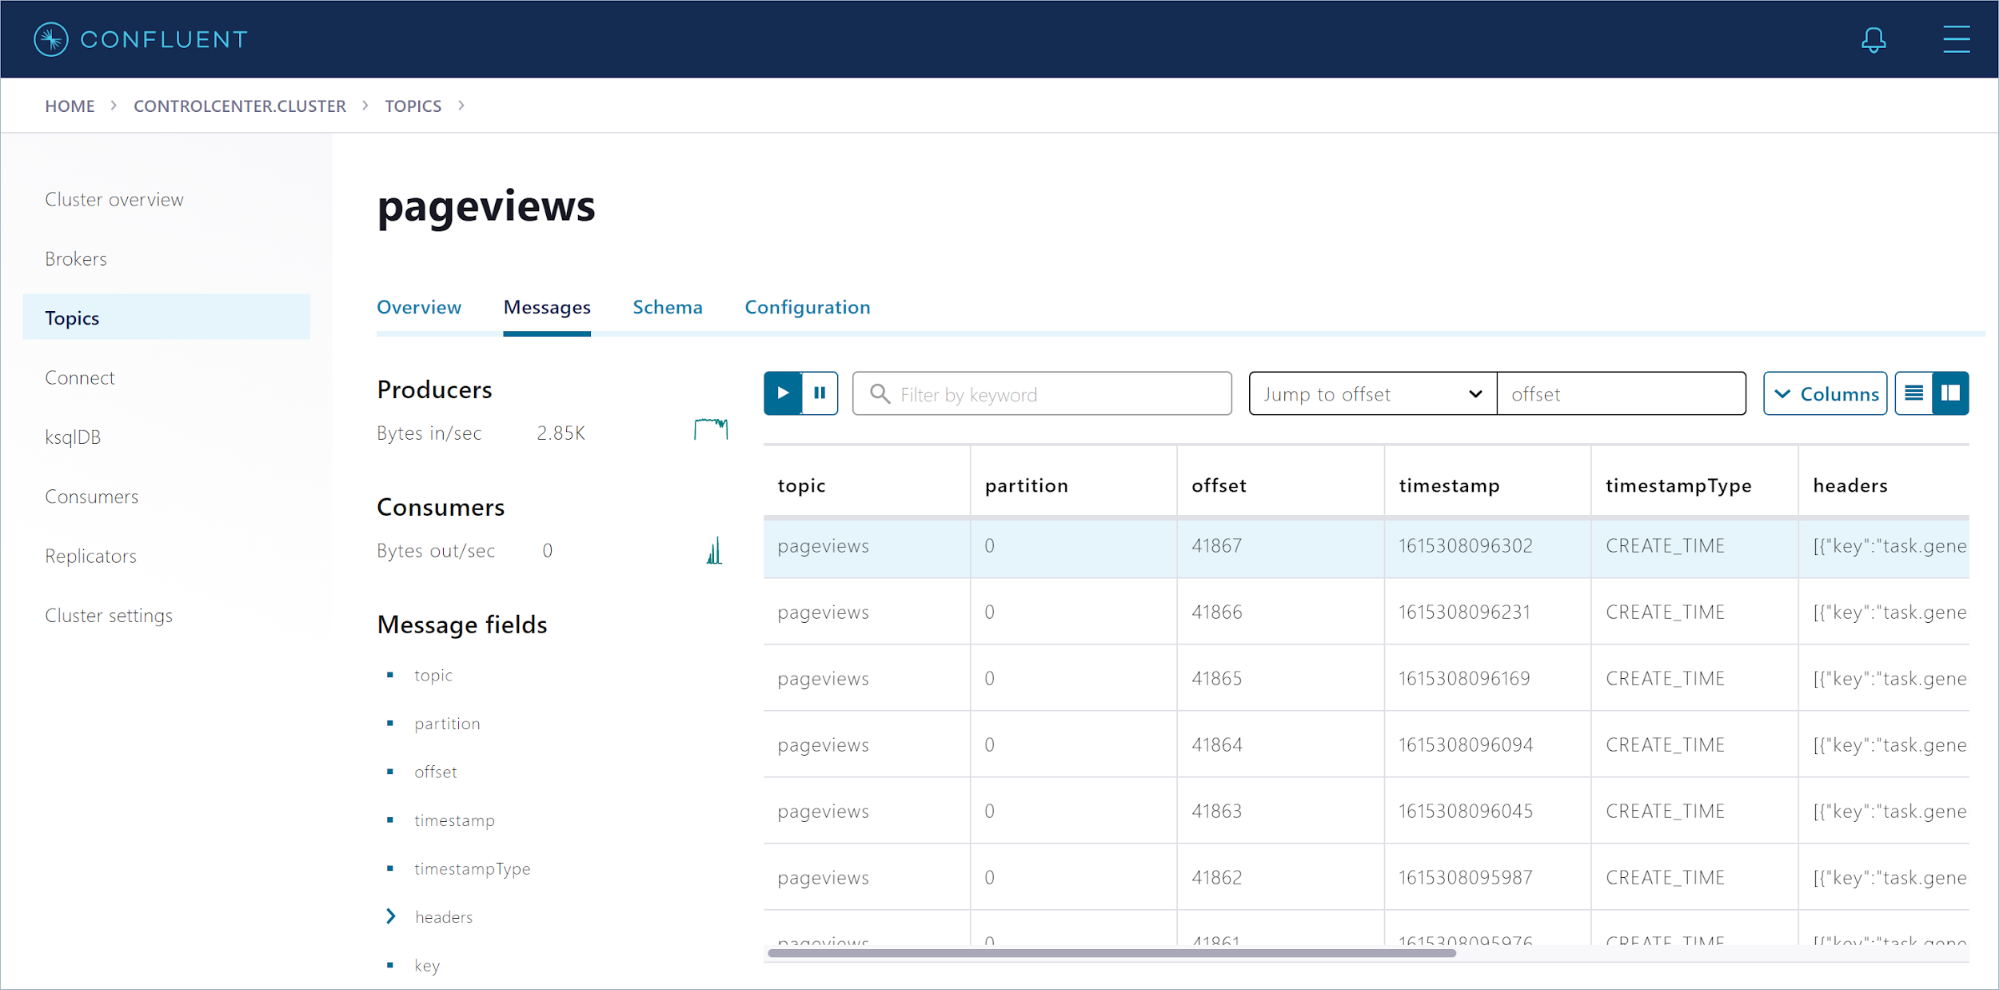
Click Messages to see the events as they arrive, in real-time.
Create a stream
Confluent is all about data in motion, and ksqlDB enables you to process your data in real-time by using SQL statements.
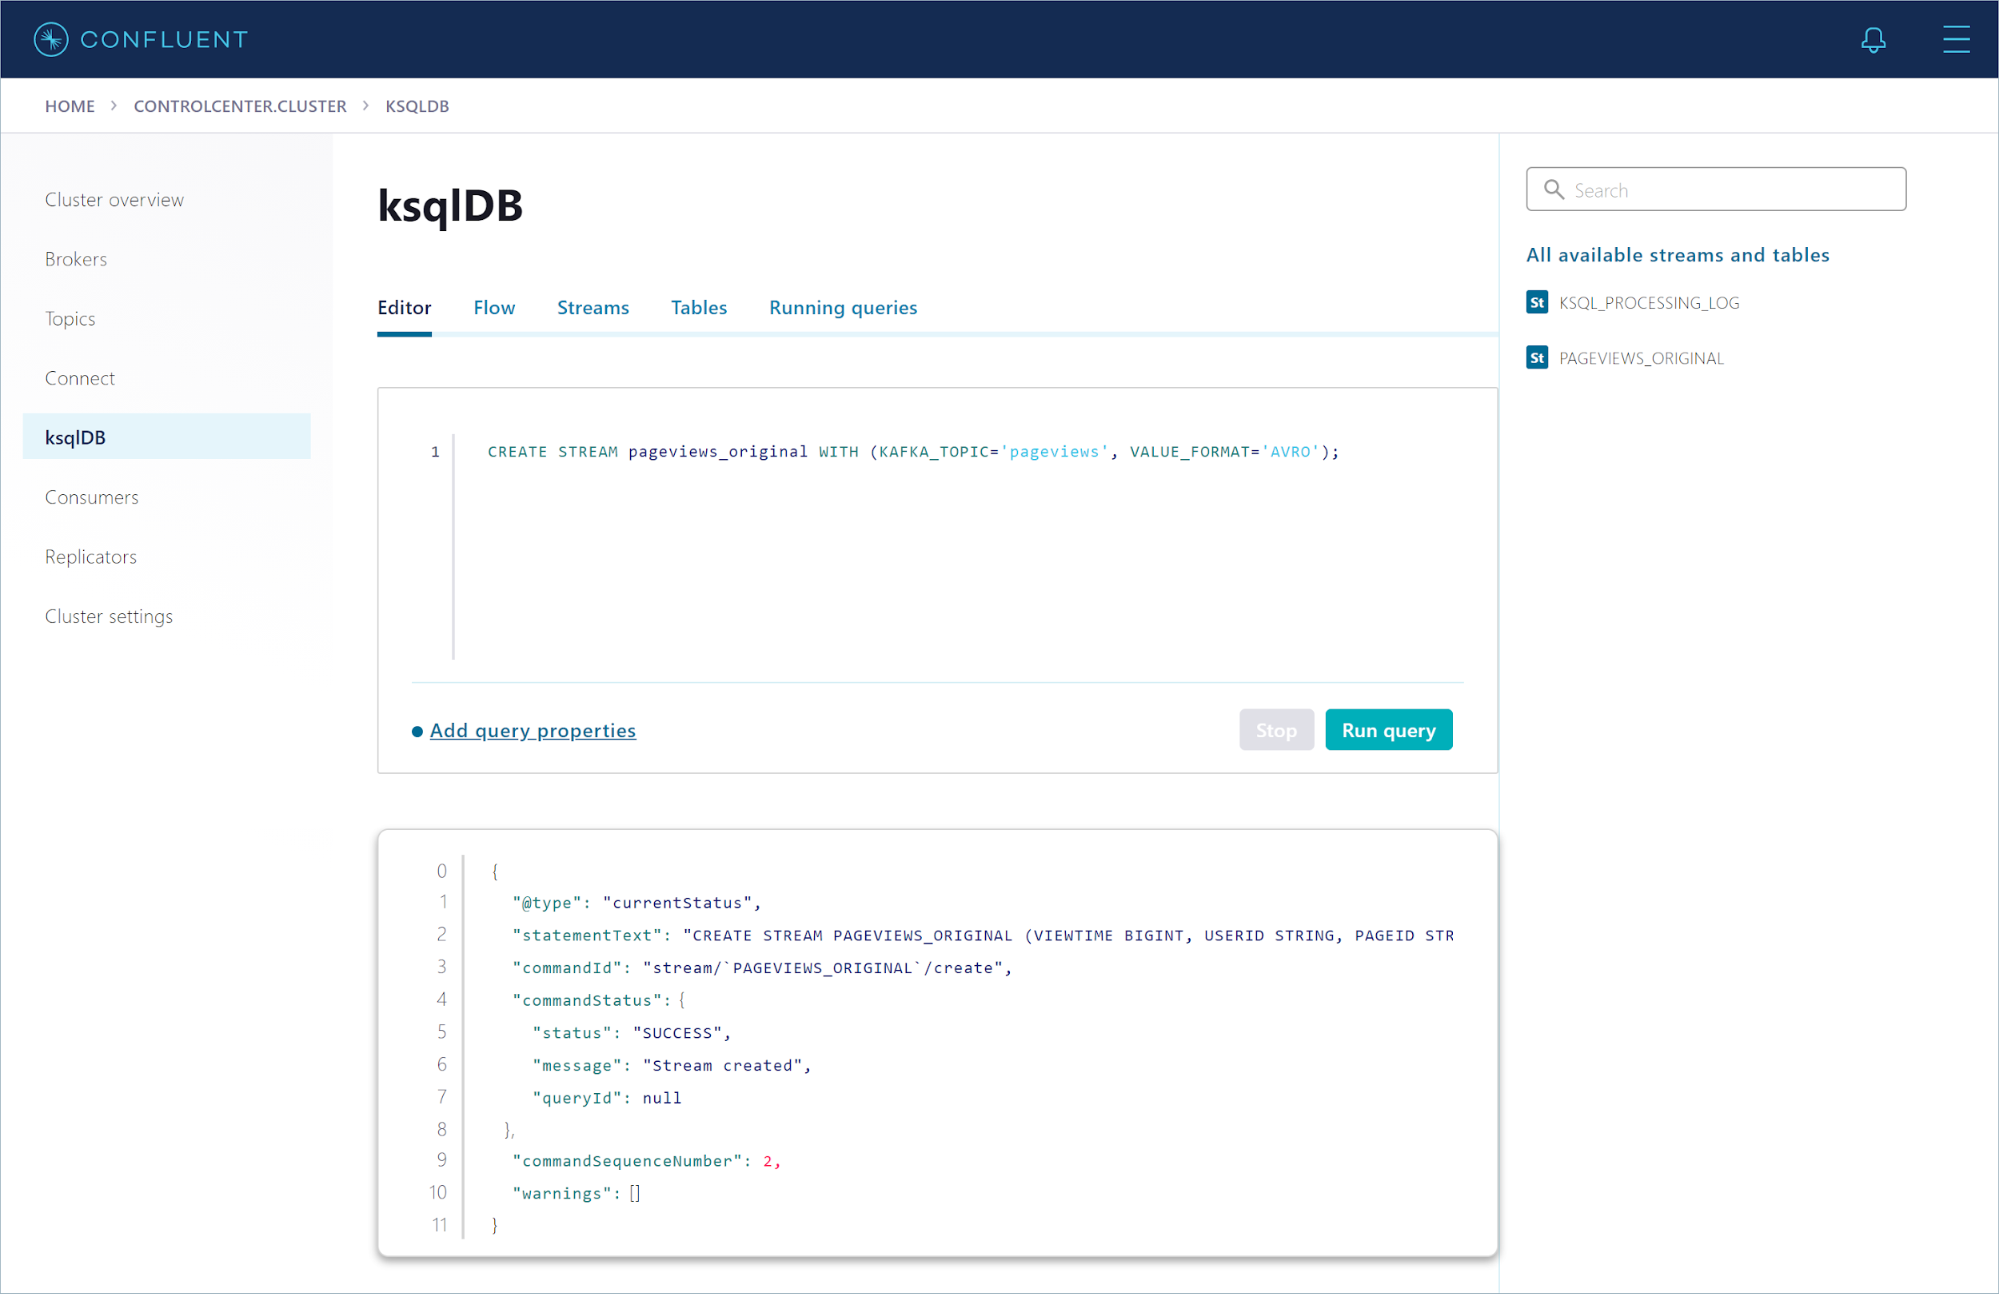
In the navigation menu, click ksqlDB to open the “ksqlDB Applications” page. Click the default ksqlDB app to open the query editor.
The following SQL statement registers a stream on the pageviews topic:
CREATE STREAM pageviews_original WITH (KAFKA_TOPIC='pageviews', VALUE_FORMAT='AVRO');
Copy this statement into the query editor and click Run query.
Run the following statement to query the stream for all page views from User_2:
SELECT * FROM pageviews_original WHERE userid='User_2' EMIT CHANGES;
The query results pane shows events as they arrive, in real time.
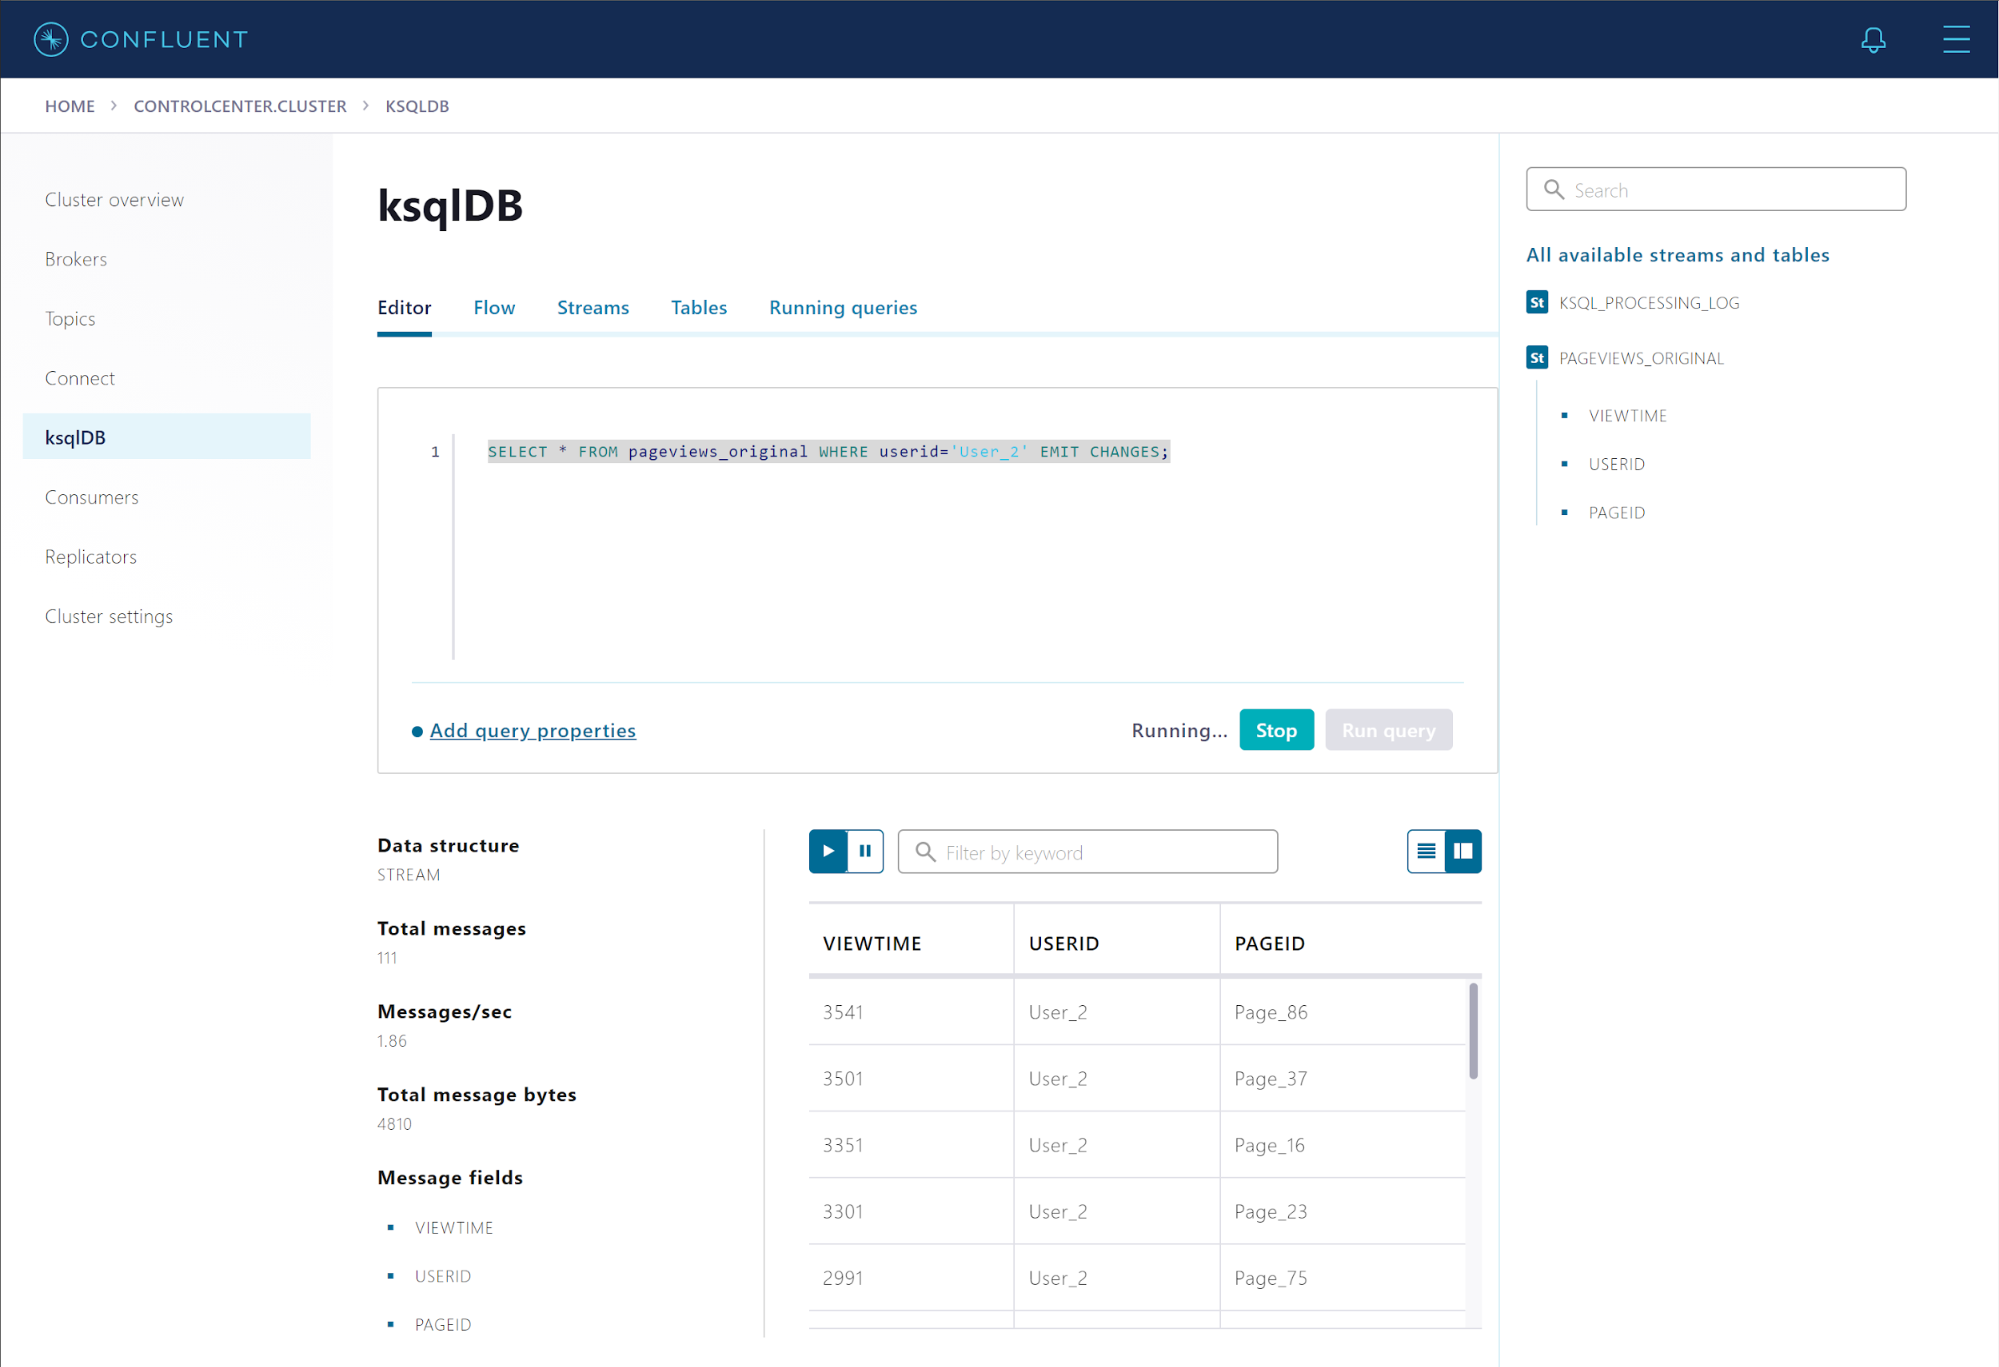
In the “All available streams and tables” pane on the right, click PAGEVIEWS_ORIGINAL to see the stream’s schema.
Click Stop to end the query. That was a transient query, which is a client-side query that runs only for the duration of the client session. A persistent query is a server-side query that runs on the cluster until it receives a TERMINATE command. You can build an entire stream processing application with just a few persistent queries.
Populate your stream with records
The pageviews_original stream reads records from the pageviews topic, but you can also populate the stream with records that you inject, by using the INSERT INTO statement.
In the query editor, run the following statements to populate the stream with three records.
INSERT INTO pageviews_original (viewtime, userid, pageid) VALUES (999000, 'User_23', 'Page_9000');
INSERT INTO pageviews_original (viewtime, userid, pageid) VALUES (999001, 'User_42', 'Page_9001');
INSERT INTO pageviews_original (viewtime, userid, pageid) VALUES (999002, 'User_99', 'Page_9002');
Query the stream for one of the records that you just inserted.
In the query editor, click Add query properties and change the auto.offset.reset property to Earliest, so subsequent queries will find the records you inserted.
Run the following statement to query the stream for User_42.
SELECT * FROM pageviews_original WHERE userid ='User_42' EMIT CHANGES LIMIT 1;
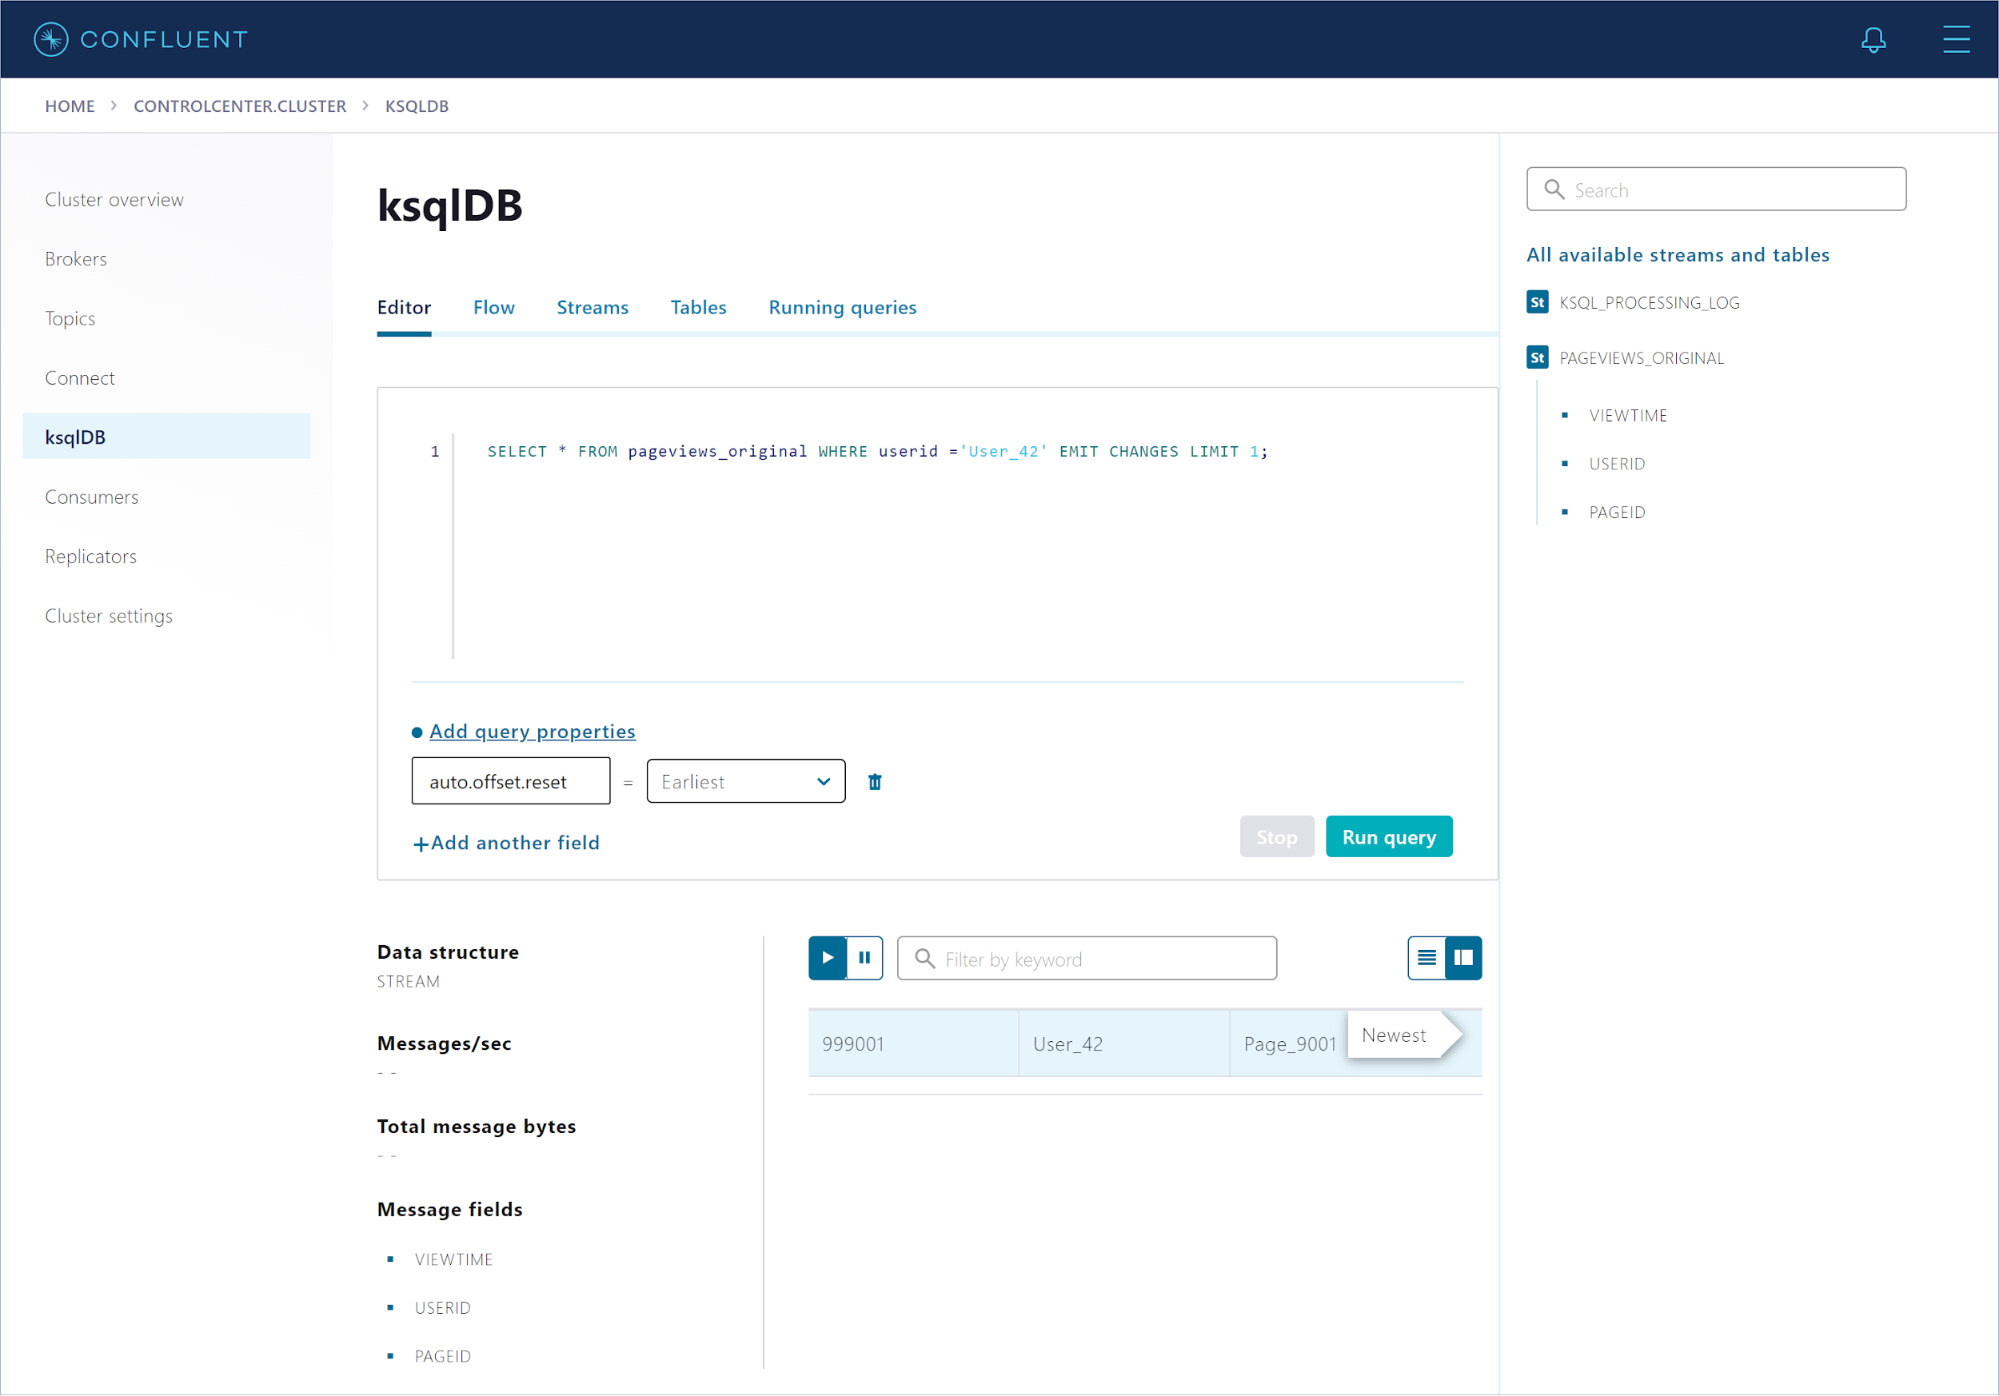
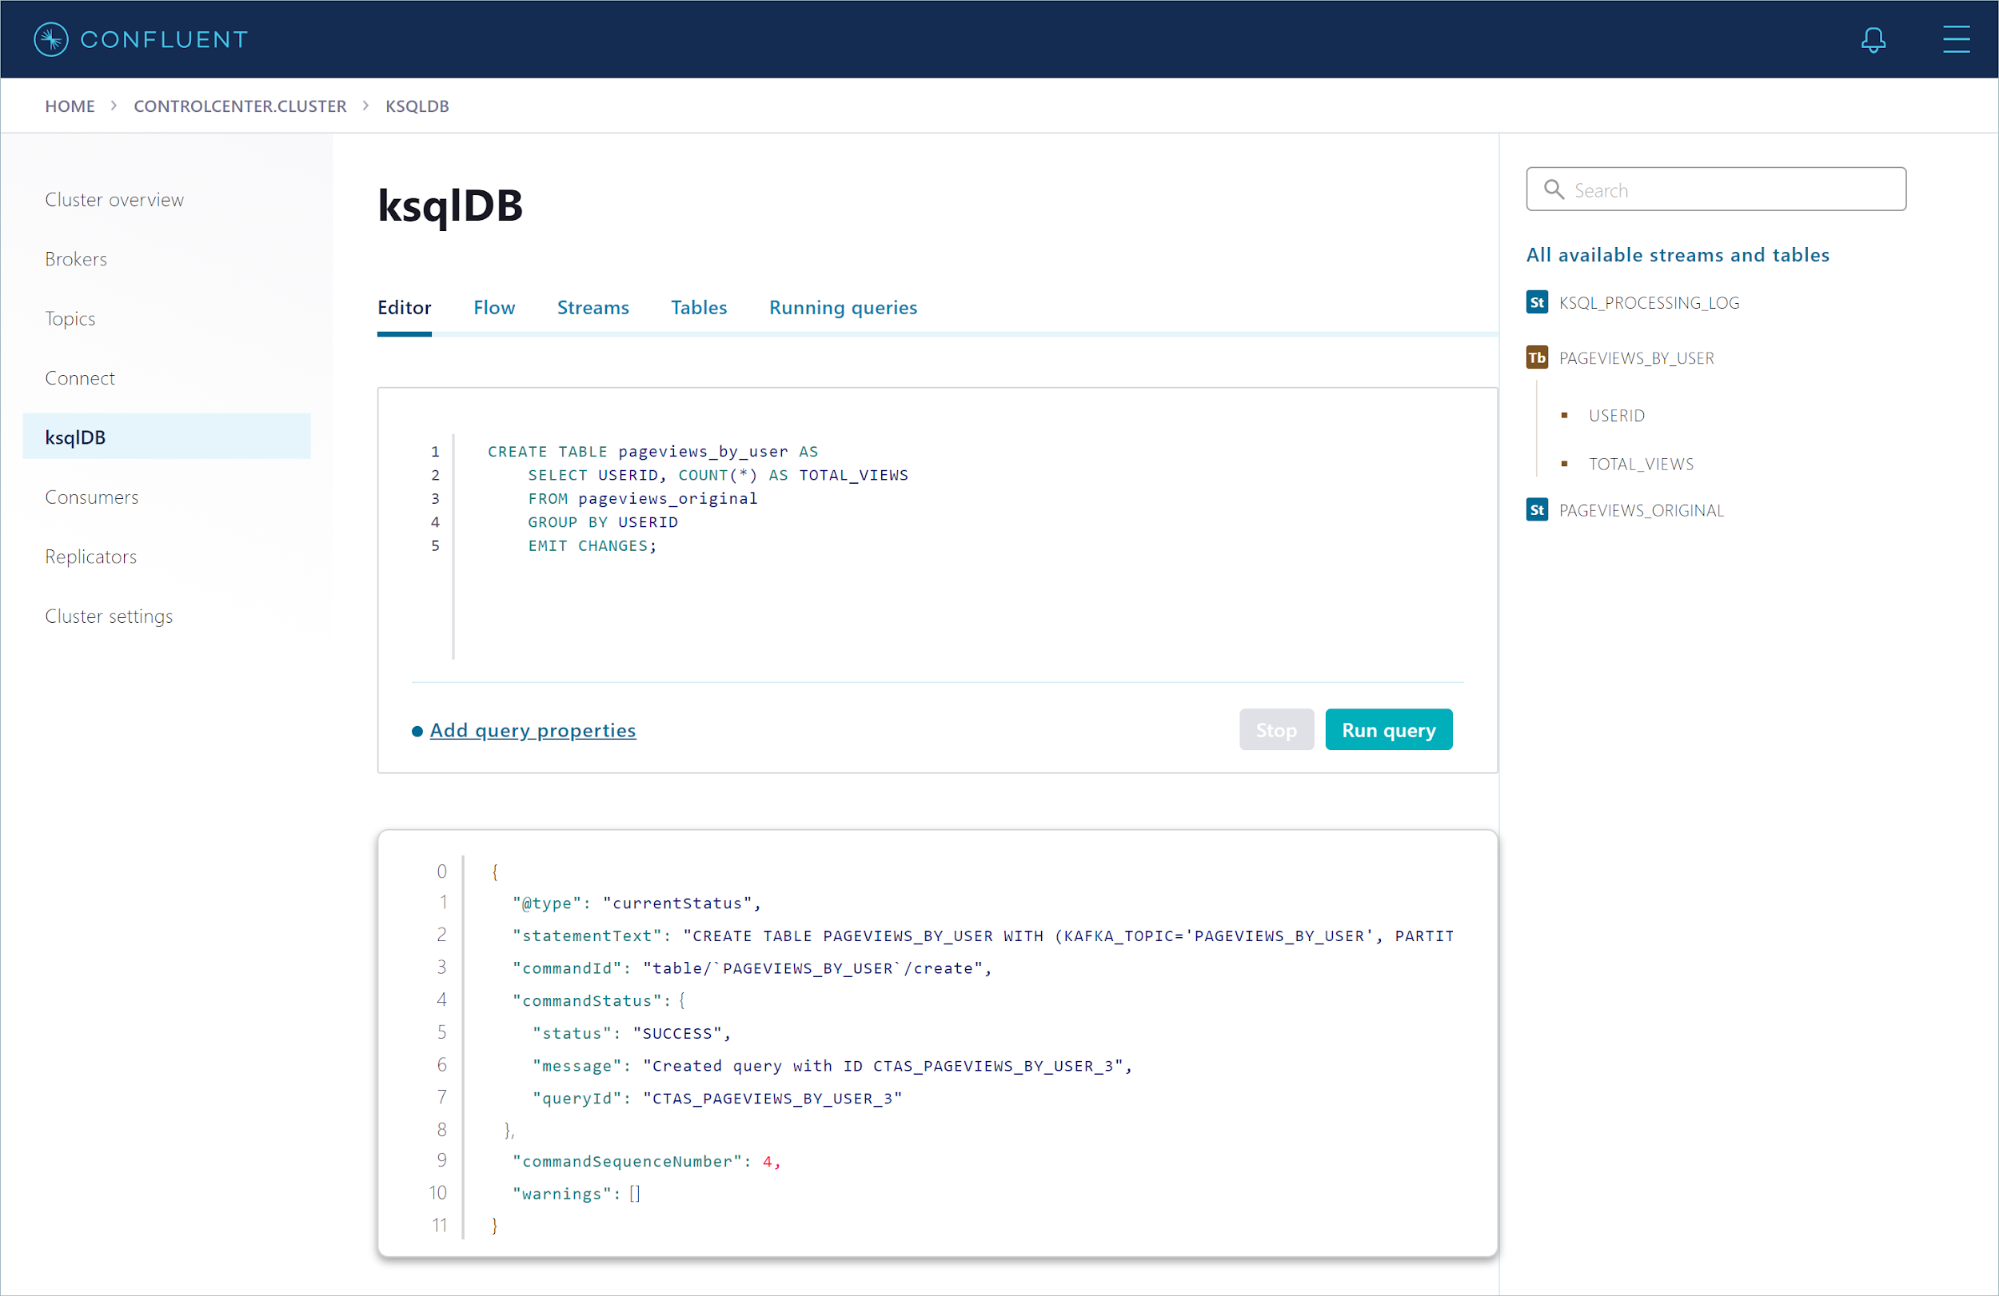
Run the following statement to create a persistent query that counts the total number of page views for each user in the pageviews_original stream:
CREATE TABLE pageviews_by_user AS
    SELECT USERID, COUNT(*) AS TOTAL_VIEWS
    FROM pageviews_original
    GROUP BY USERID
    EMIT CHANGES;
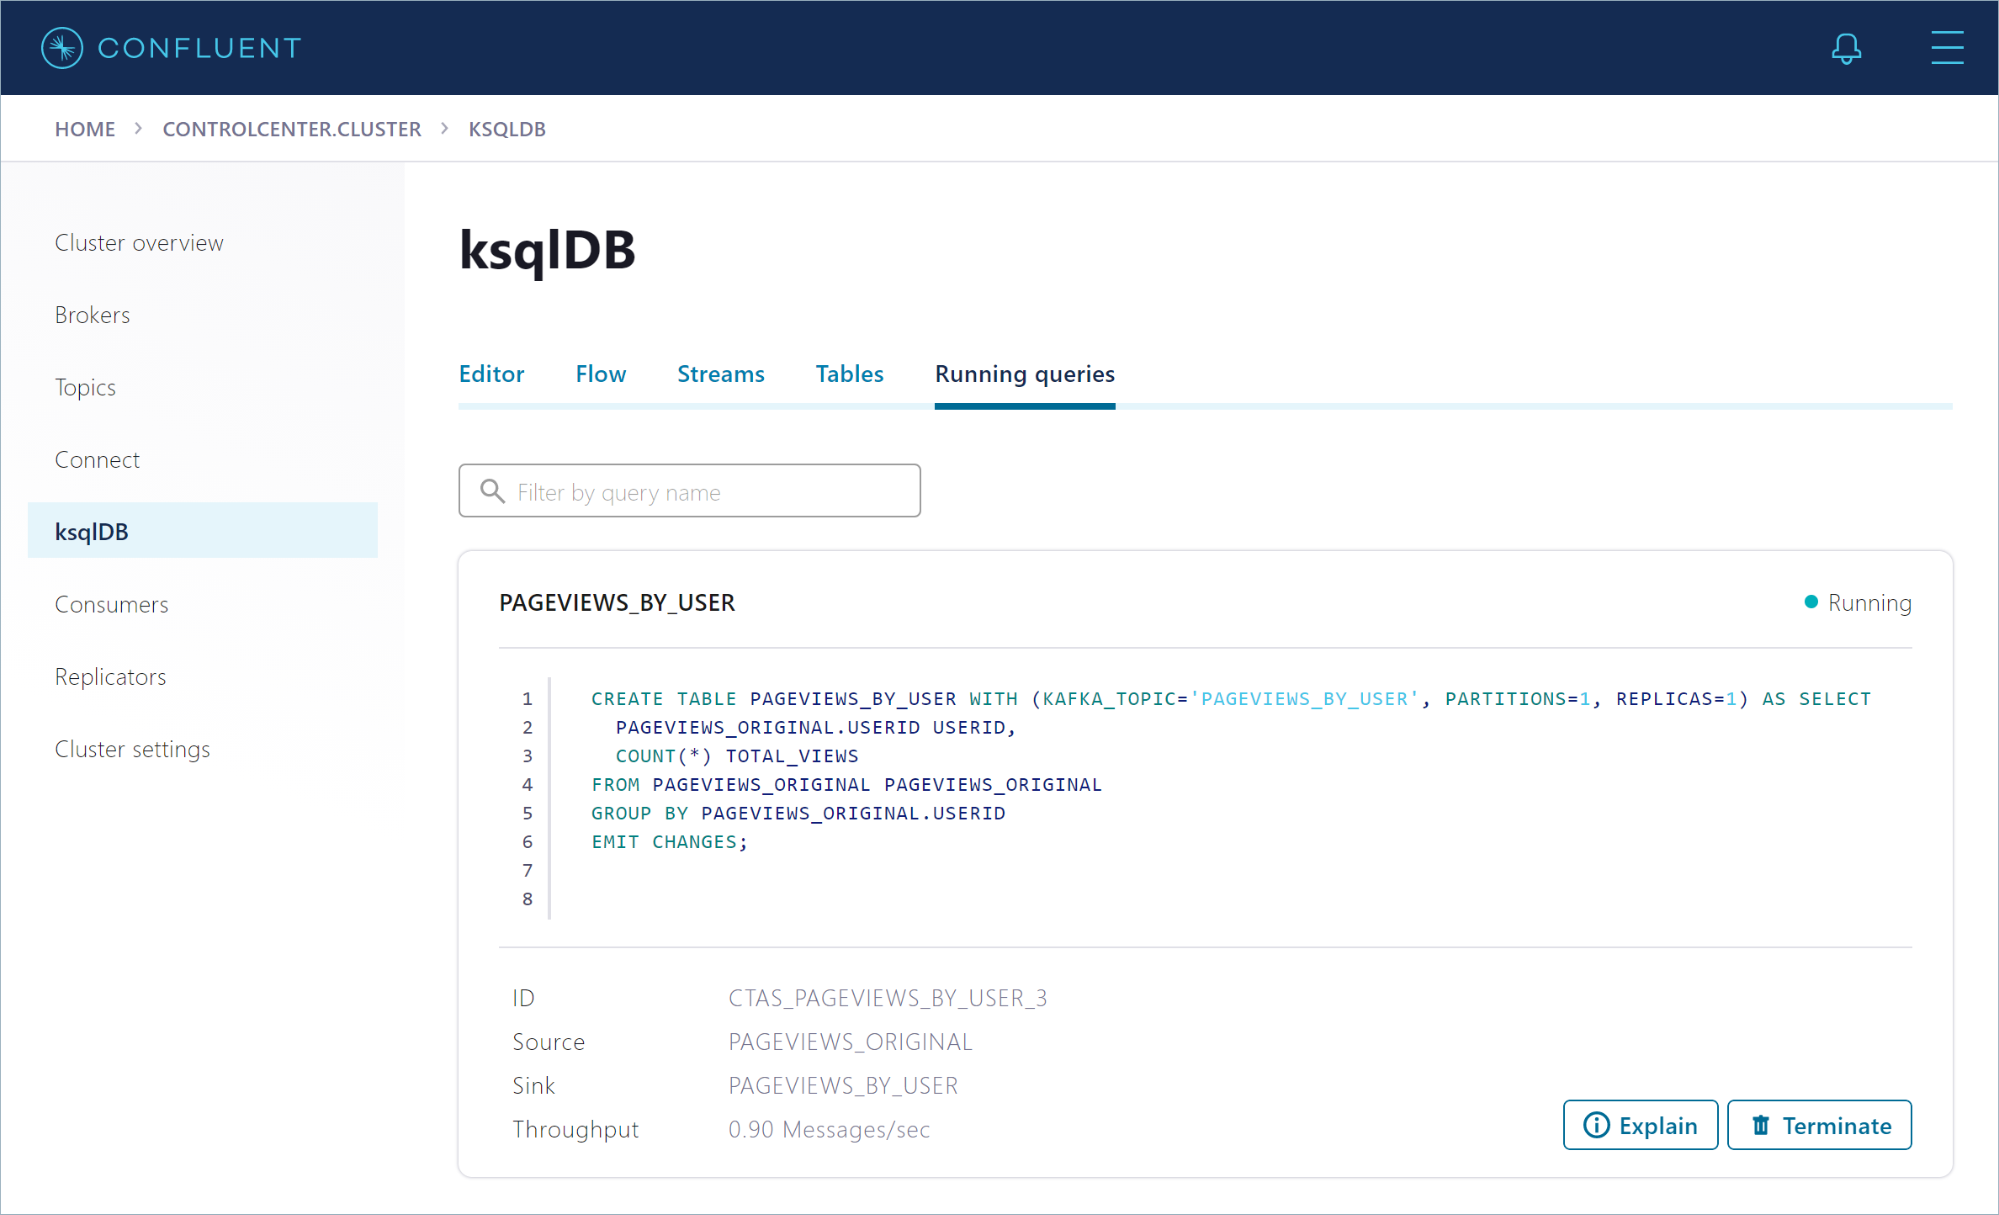
Click Running queries to view details about your persistent query. Notice that the query ID starts with CTAS_PAGEVIEWS_BY_USER_*.
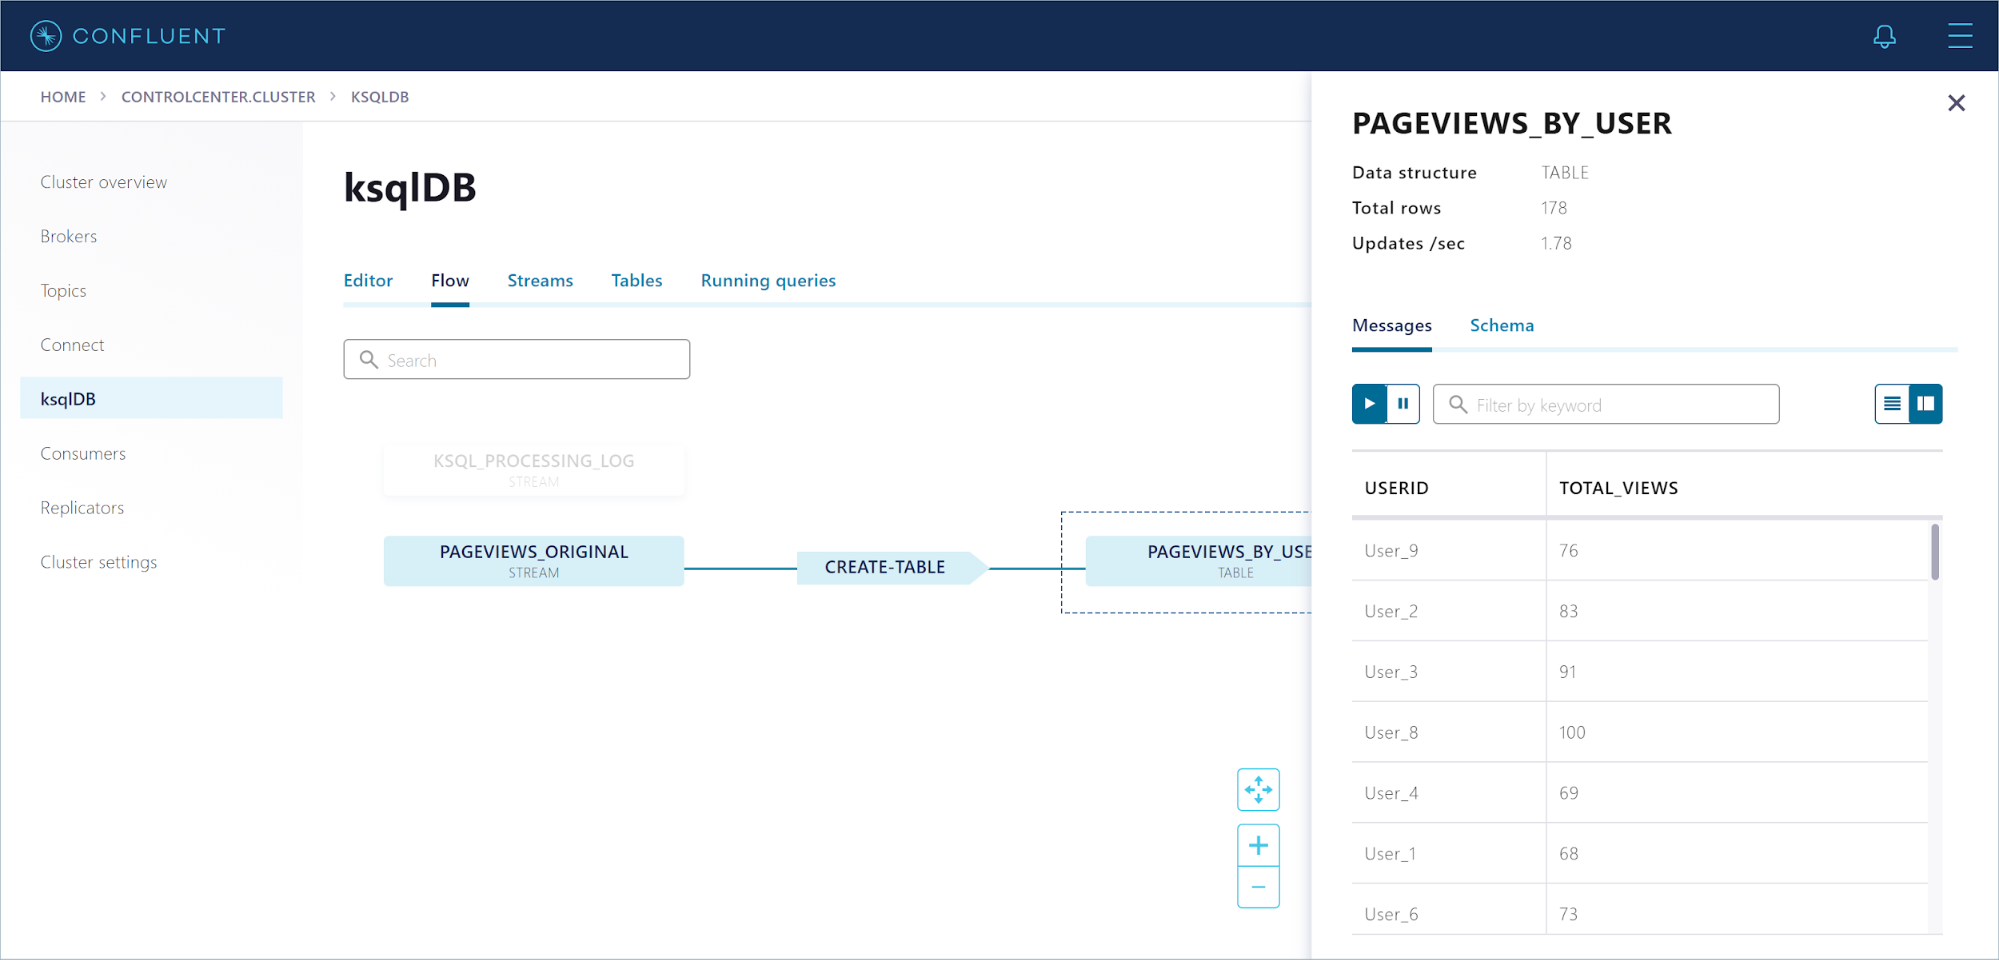
Click Flow to view the topology of your ksqlDB application. Click the PAGEVIEWS_BY_USER node to see the messages flowing through your table.
View consumer lag and consumption details
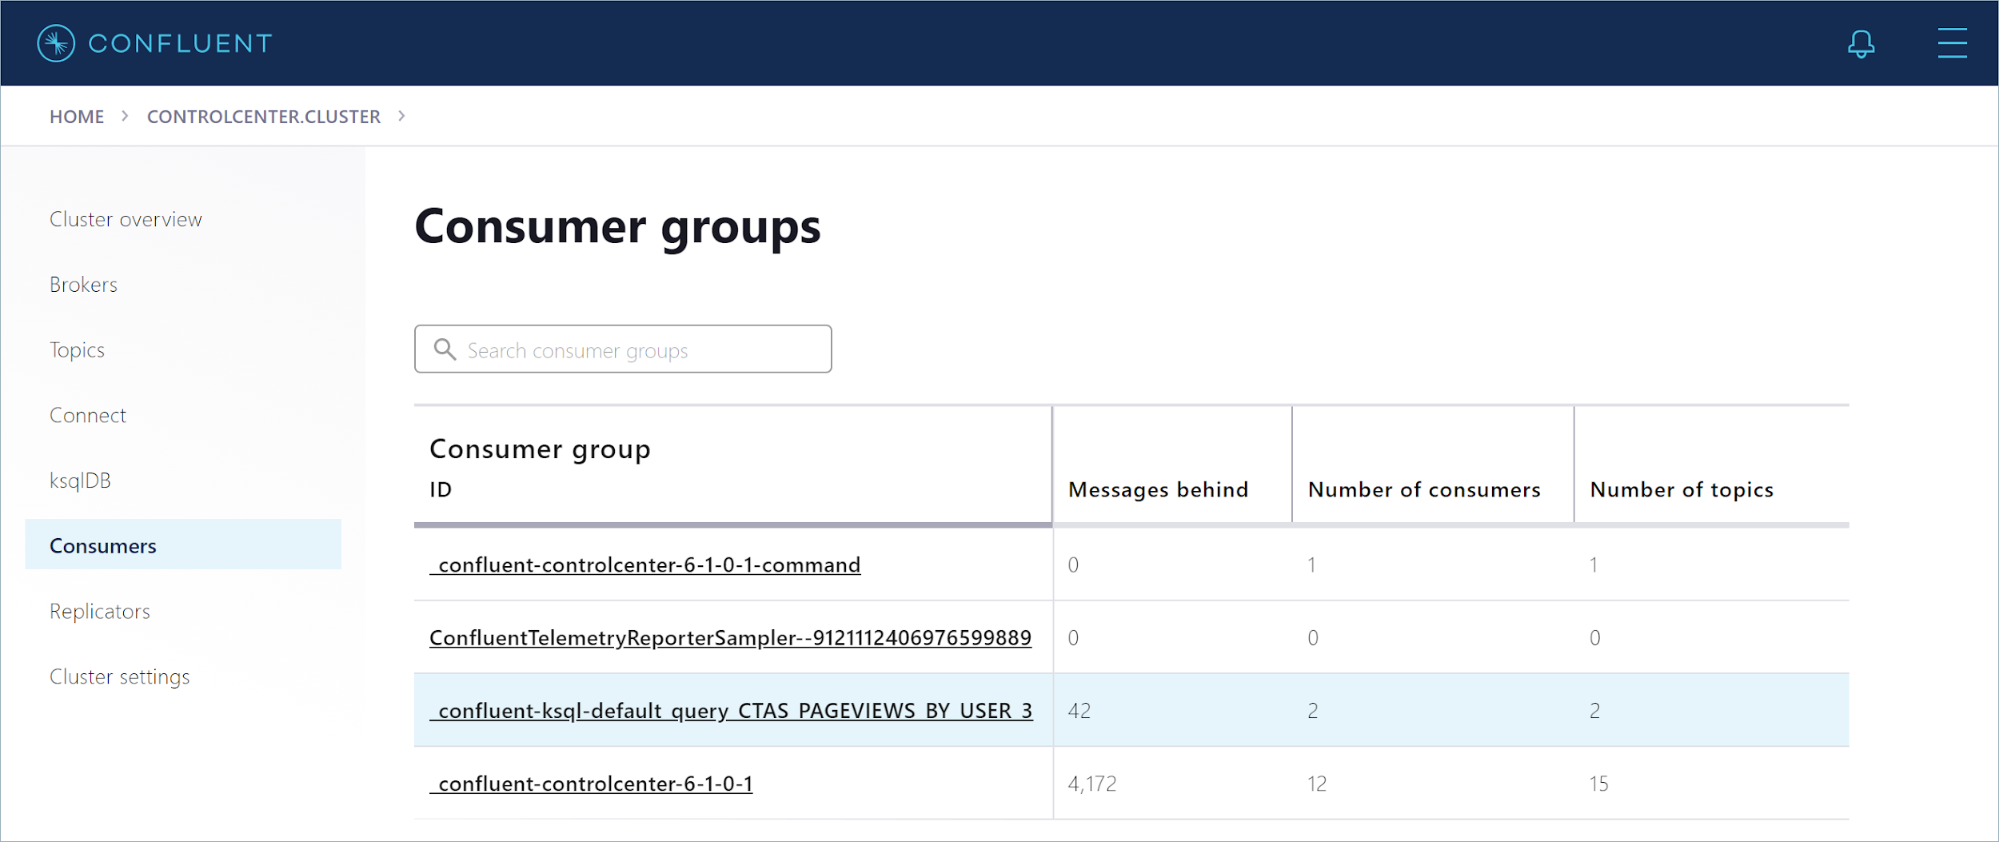
In the navigation menu, click Consumers to open the “Consumer Groups” page.
In the list of consumer groups, find the group for your persistent query. The group name starts with _confluent-ksql-default_query_CTAS_PAGEVIEWS_BY_USER_*.
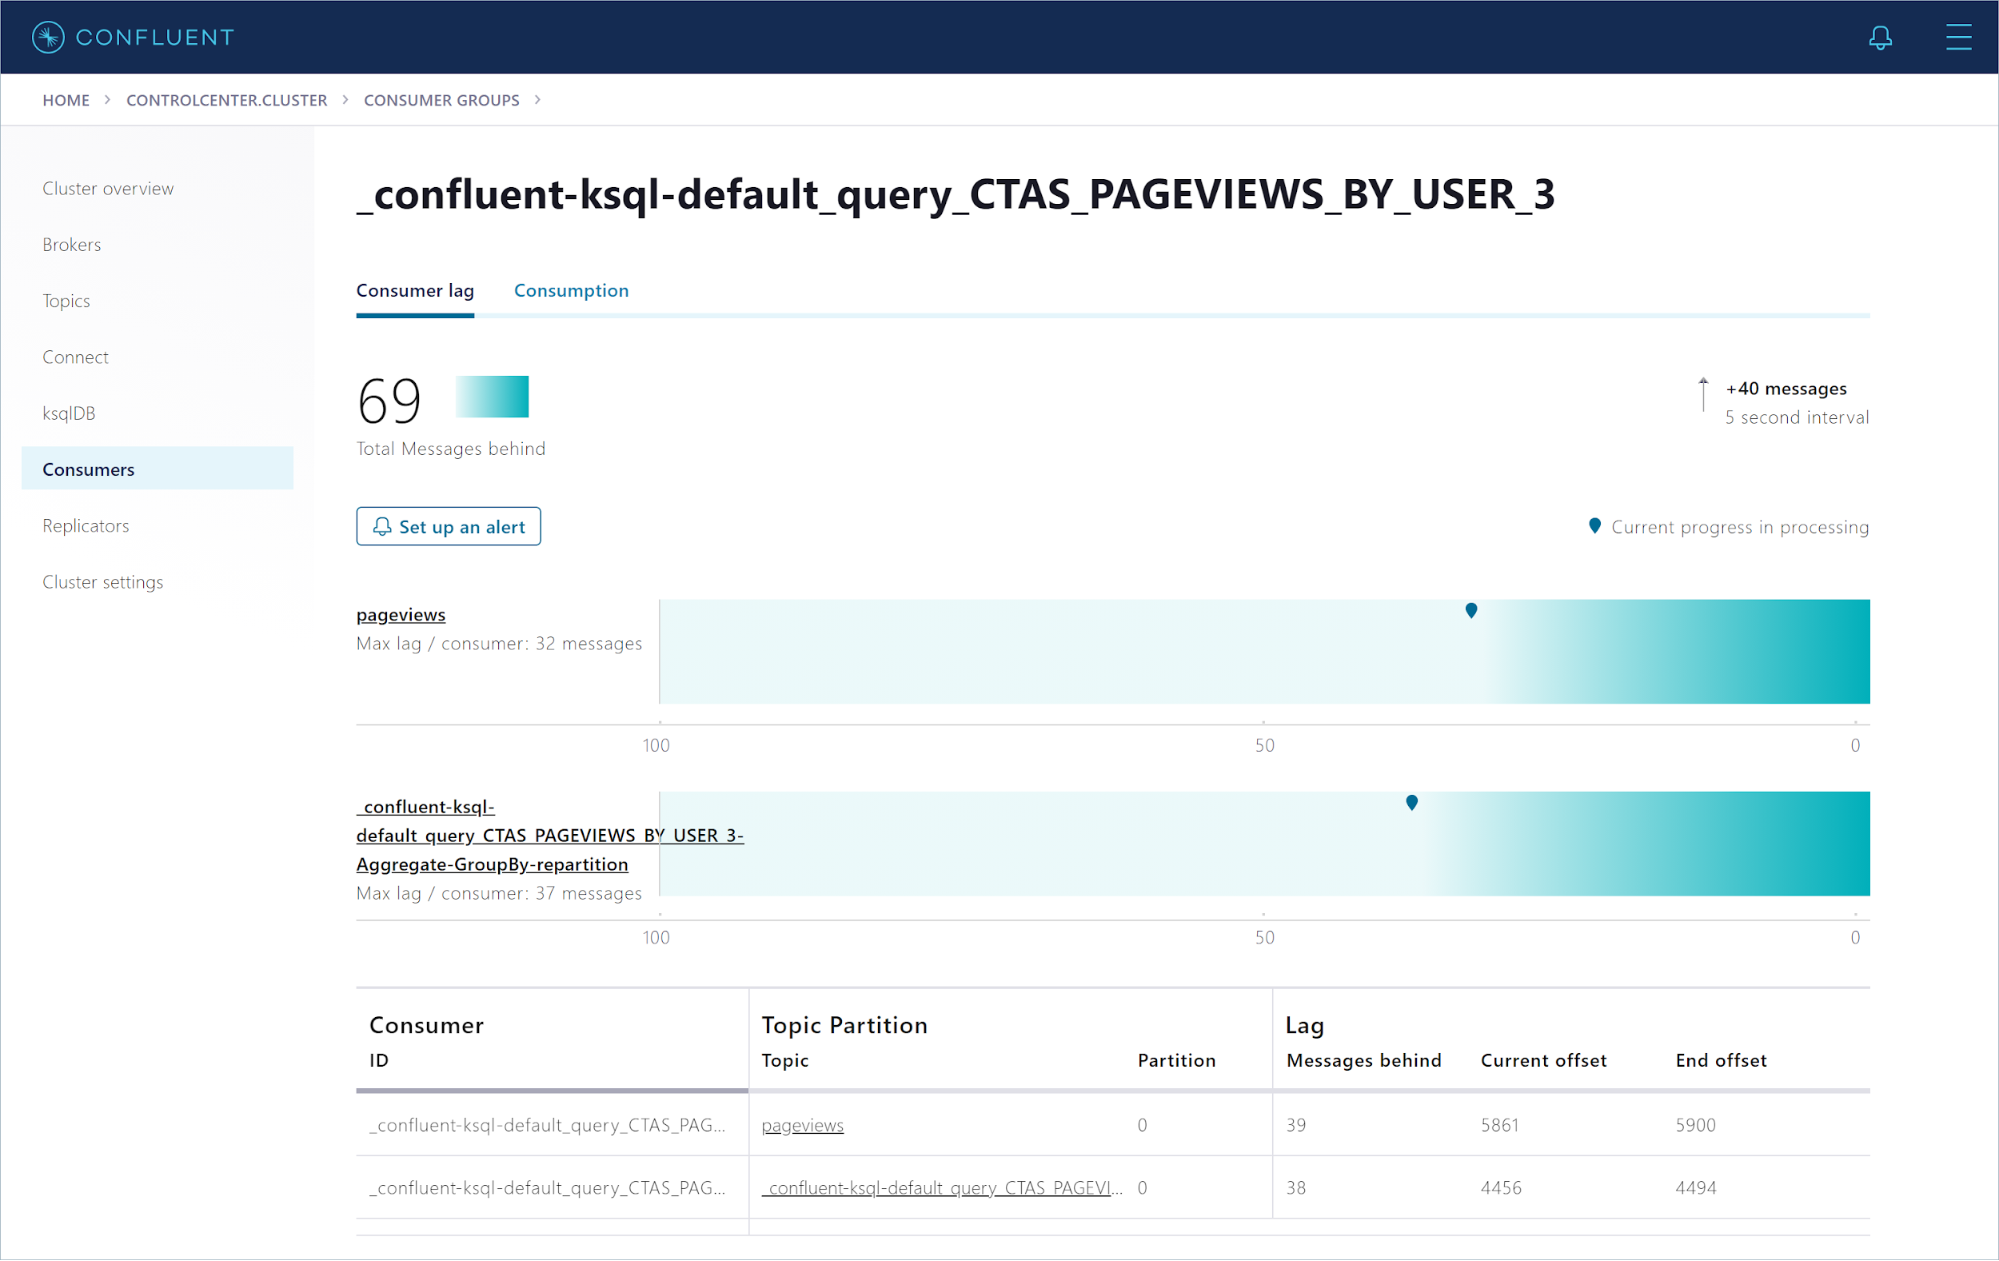
Click the CTAS_PAGEVIEWS_BY_USER consumer group to see how well the query consumer is keeping up with the incoming data.
Stop the Confluent components
When you’re done experimenting with Confluent Control Center, run the following command to stop the clusters:
confluent local services stop
To clean up and reset the state of the installation, run the following command:
confluent local destroy
You’re just getting started!
In just a few steps, you’ve set up a Confluent cluster on your local machine and produced data to a Kafka topic. You’ve registered a stream on the topic and created a table to aggregate the data. Finally, you’ve used SQL to issue queries against the stream and table and seen the results in real-time.
If you want the power of stream processing without managing your own clusters, give Confluent Cloud a try! When you sign up, you’ll receive $400 to spend within Confluent Cloud during your first 60 days, plus an additional $60 of free usage when you use the promo code CL60BLOG.*
Did you like this blog post? Share it now
Subscribe to the Confluent blog
New with Confluent Platform 7.9: Oracle XStream CDC Connector, Client-Side Field Level Encryption (EA), Confluent for VS Code, and More
This blog announces the general availability of Confluent Platform 7.9 and its latest key features: Oracle XStream CDC Connector, Client-Side Field Level Encryption (EA), Confluent for VS Code, and more.
Meet the Oracle XStream CDC Source Connector
Confluent's new Oracle XStream CDC Premium Connector delivers enterprise-grade performance with 2-3x throughput improvement over traditional approaches, eliminates costly Oracle GoldenGate licensing requirements, and seamlessly integrates with 120+ connectors...

