To learn more about building streaming data pipelines with Apache Kafka and KSQL, you can:
[Webinar] How to Solve 7 Common Kafka Mistakes | Register Today
We ❤ syslogs: Real-time syslog Processing with Apache Kafka and KSQL – Part 2: Event-Driven Alerting with Slack
Event-Driven Push Notifications with Python and Kafka
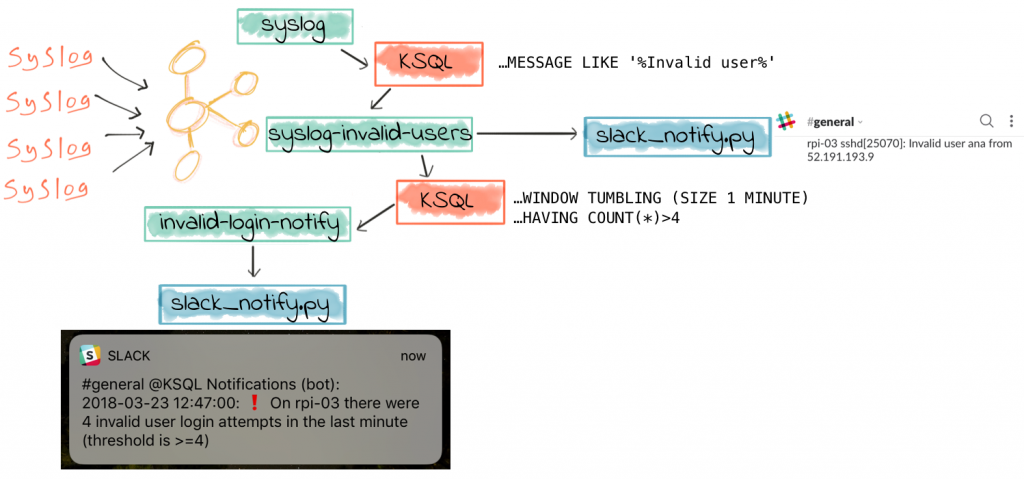
One of the great things about KSQL is how you can filter large volumes of data in real time to just identify events of particular importance. With these events, we often want to do something, like drive a process, take an action, or tell someone. Considering the latter of these—notifying someone that something’s happened—there are various ways of doing this. Most people have a mobile phone, and so a push notification is a common mechanism.
Slack is a messaging application, common in many workplaces. Think of it as IRC, but with animated GIFs. It’s free to get started with, has an API, and it supports push notifications—making it an ideal candidate for this prototype push-notification application that we’re going to build. I’m going to use the Slack Python client that Slack provides, in conjunction with the Confluent Kafka Python client that’s available standalone or bundled with Confluent Platform. We’ll subscribe to a Kafka topic, and based on messages received send a notification through Slack. The use-case will be notifying a user when suspicious login activities are detected in the syslog.
Filtering syslog Data in Real Time with KSQL
As we saw in part 1 of this series, the source data is from numerous servers and devices, all sending their syslog data to Kafka Connect running the kafka-connect-syslog plugin. This streams the data into a Kafka topic:
ksql> SELECT HOSTNAME, MESSAGE FROM SYSLOG;
proxmox01.moffatt.me | I ❤  logs
proxmox01.moffatt.me | I still ❤  logs
from where KSQL populates in real time a derived stream, in this case with only suspicious login attempts present:

ksql> CREATE STREAM SYSLOG_INVALID_USERS AS \
SELECT * \
FROM SYSLOG \
WHERE HOST='rpi-03' AND MESSAGE LIKE '%Invalid user%';ksql> SELECT * FROM SYSLOG_INVALID_USERS LIMIT 1; 1520176464386 | //192.168.10.105:38254 | 1520176464000 | 4 | rpi-03 | 6 | rpi-03 sshd[24150]: Invalid user mini from 192.168.42.42 | UTF-8 | /192.168.10.105:38254 | rpi-03.moffatt.me LIMIT reached for the partition. Query terminated
Push Notifications to Slack from Python
To get started you need to have a Slack workspace (create one for free if necessary), and your API keys. I’m taking a lot of the boilerplate code below from this article on using Slack’s Python client, and this article on using the Confluent Kafka Python client. I make no claims to be a good or stylish Python coder, but this is a prototype, so ¯\_(ツ)_/¯ #TechnicalDebtFTW 😉
First up, let’s install the Slack library:
pip install slackclient
Now run this Python code to check that your API keys are working. You can find more details and examples of using the API from Python in the documentation.
You should see a message popup in the #general channel:

Now let’s hook this up to Kafka!
Consuming Kafka Messages in Python
Whilst Apache Kafka ships with client libraries for Java and Scala, Confluent adds support for other languages, including Python, C/C++, .NET and Go, as part of the Confluent Platform. To install the Confluent Kafka Python client run:
pip install confluent-kafka
Let’s run some very simple Python code to check that things work:
At this point, nothing will happen—because the Python script is waiting for a message on the TEST topic. Let’s give it one! We’re going to use the kafka-console-producer utility to do this:
$ kafka-console-producer \
--broker-list localhost:9092 \
--topic TEST
Nothing will happen, as it’s now waiting for input on stdin. Enter a test message:
{"f1": "value1"}
And you should see in the output from the Python script:
{u'f1': u'value1'}
Kafka + Slack = Push Notifications on Kafka Topics!
So with both pieces of the puzzle proven and tested, let’s combine them. This simple script listens on a Kafka topic called KSQL_NOTIFY, and uses the message it receives to send a Slack notification. The target channel (or user), are taken from the Kafka message itself, as is the text to send.
Test it out as before, with the kafka-console-producer:
$ kafka-console-producer \
  --broker-list localhost:9092 \
  --topic KSQL_NOTIFY
Enter a message on stdin:
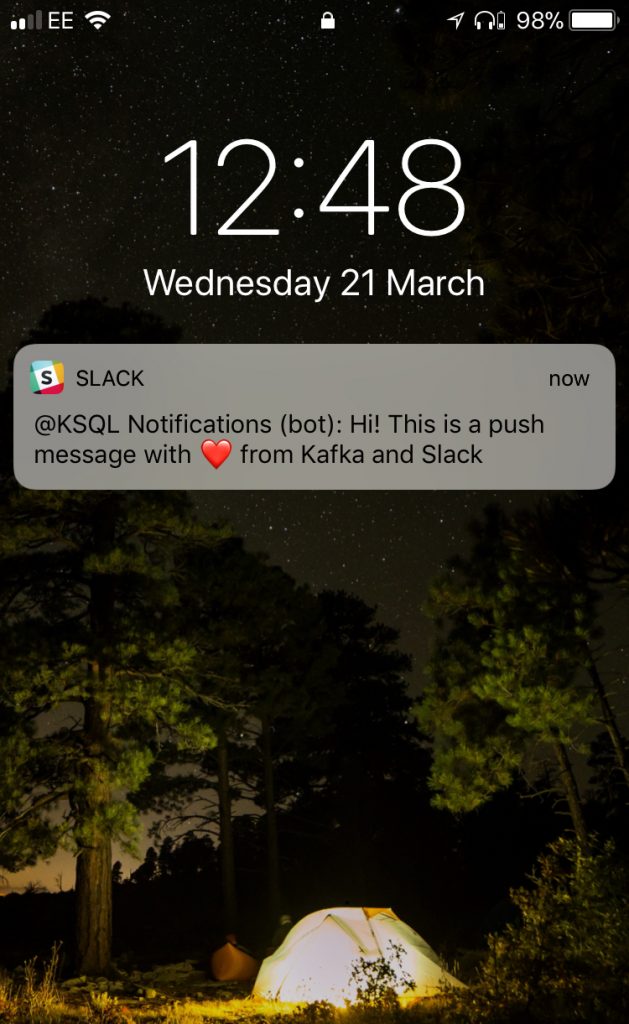
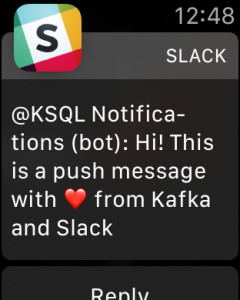
{"TEXT": "Hi! This is a push message with ❤ from Kafka and Slack", "CHANNEL": "general"}
And you should then get a notification on Slack, on whichever device you chose, including iOS and Apple Watch 🙂
Completing the Puzzle: Sending messages from KSQL to Slack
Now that we have our push notification system working, we just need to stream the desired messages to the Kafka topic. We’ve already got a derived topic which is populated in realtime with any syslog events matching our filter criteria (“Invalid user”, usually indicating an unauthorised login attempt):
ksql> DESCRIBE EXTENDED SYSLOG_INVALID_USERS;Type : STREAM Key field : Timestamp field : Not set - using <ROWTIME> Key format : STRING Value format : AVRO Kafka output topic : SYSLOG_INVALID_USERS (partitions: 4, replication: 1)
Field | Type -------------------------------------------- ROWTIME | BIGINT (system) ROWKEY | VARCHAR(STRING) (system) DATE | BIGINT FACILITY | INTEGER HOST | VARCHAR(STRING) LEVEL | INTEGER MESSAGE | VARCHAR(STRING) CHARSET | VARCHAR(STRING) REMOTE_ADDRESS | VARCHAR(STRING) HOSTNAME | VARCHAR(STRING) --------------------------------------------
Queries that write into this STREAM ----------------------------------- id:CSAS_SYSLOG_INVALID_USERS - CREATE STREAM SYSLOG_INVALID_USERS AS SELECT * FROM SYSLOG WHERE HOST='rpi-03' AND MESSAGE LIKE '%Invalid user%';
For query topology and execution plan please run: EXPLAIN <QueryId>
Local runtime statistics ------------------------ messages-per-sec: 0 total-messages: 2700 last-message: 3/23/18 10:53:18 AM GMT failed-messages: 0 failed-messages-per-sec: 0 last-failed: n/a (Statistics of the local KSQL server interaction with the Kafka topic SYSLOG_INVALID_USERS) ksql>
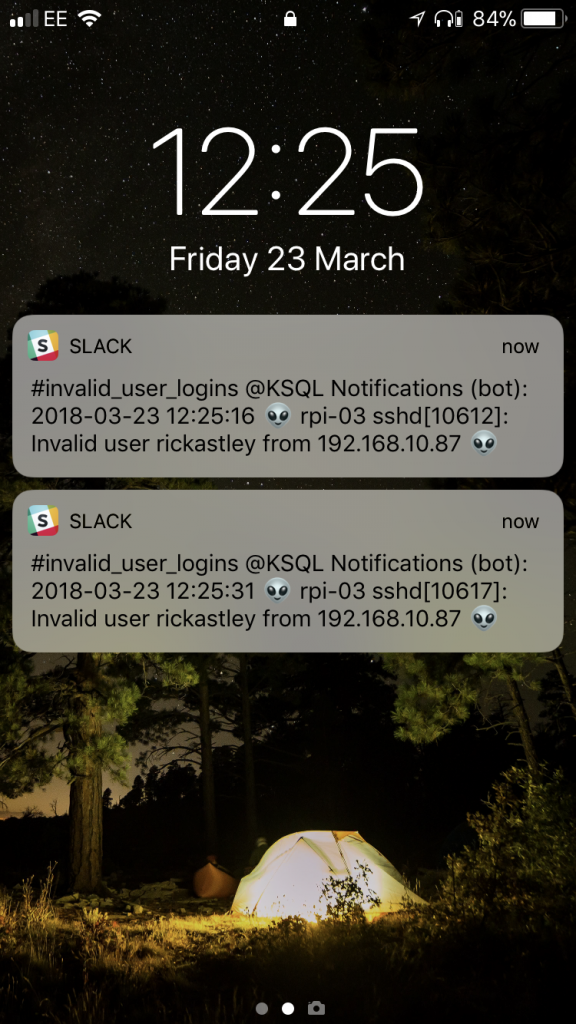
Now we can further refine this stream in order to trigger our Slack push notifications, populating the topic our Python script is subscribed to, KSQL_NOTIFY
CREATE STREAM KSQL_NOTIFY WITH (VALUE_FORMAT='JSON') AS \
SELECT TIMESTAMPTOSTRING(DATE, 'yyyy-MM-dd HH:mm:ss') + ' 👽 ' + MESSAGE + ' 👽' AS TEXT, \
       'general' AS CHANNEL \
FROM SYSLOG_INVALID_USERS;
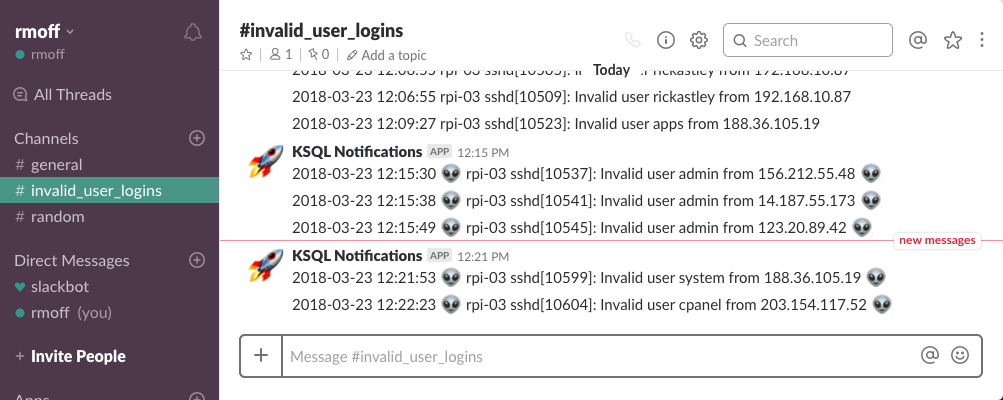
You may get this error from KSQL:
io.confluent.ksql.exception.KafkaTopicException: Topic 'KSQL_NOTIFY' does not conform to the requirements Partitions:1 v 4. Replication: 1 v 1
What this means is that the KSQL_NOTIFY topic already exists (because we created it implicitly above), and doesn’t match the partition and/or replication factor that KSQL expects. To workaround this, you can specify overrides in the WITH clause. For example, to specify that the topic is to have 1 partition and 1 replica, you’d use:
ksql> CREATE STREAM KSQL_NOTIFY WITH (VALUE_FORMAT='JSON', PARTITIONS=1) AS \
[...]
Terminating the Stream
Depending on how voracious the bots are that are scanning my servers, this trickle (or…stream) of notifications could turn into somewhat of a deluge, which is not really so useful. After all, the whole point of notifications is for someone to take action on someone, or at least be aware of an abnormal condition. So what we can do here is use KSQL’s aggregation capabilities to refine our alerting into a basic form of anomaly detection. Before we do this, let’s terminate the streaming query that’s populating KSQL_NOTIFY:
DROP STREAM KSQL_NOTIFY;
Basic Anomaly Detection on syslog Data with KSQL
Taking the SYSLOG_INVALID_USERS stream that we created above as our starting point, we can look at how many attempted logins we’re getting per minute:
ksql> SELECT HOST,COUNT(*) FROM SYSLOG_INVALID_USERS WINDOW TUMBLING (SIZE 1 MINUTE) GROUP BY HOST;
rpi-03 | 1
rpi-03 | 2
rpi-03 | 4
To see which window this refers to we’ll persist the aggregate query as a table:
ksql> CREATE TABLE INVALID_USERS_LOGINS_PER_HOST AS \
SELECT HOST,COUNT(*) AS INVALID_LOGIN_COUNT \
FROM SYSLOG_INVALID_USERS \
WINDOW TUMBLING (SIZE 1 MINUTE) \
GROUP BY HOST;
Message --------------------------- Table created and running --------------------------- ksql>
Now we can query from it and show the aggregate window timestamp alongside the result:
ksql> SELECT ROWTIME, TIMESTAMPTOSTRING(ROWTIME, 'yyyy-MM-dd HH:mm:ss'), \
HOST, INVALID_LOGIN_COUNT \
FROM INVALID_USERS_LOGINS_PER_HOST;
1521644100000 | 2018-03-21 14:55:00 | rpi-03 | 1
1521646620000 | 2018-03-21 15:37:00 | rpi-03 | 2
1521649080000 | 2018-03-21 16:18:00 | rpi-03 | 1
1521649260000 | 2018-03-21 16:21:00 | rpi-03 | 4
1521649320000 | 2018-03-21 16:22:00 | rpi-03 | 2
1521649080000 | 2018-03-21 16:38:00 | rpi-03 | 2
In the above query I’m displaying the aggregate window start time, ROWTIME (which is epoch), and converting it also to a display string, using TIMESTAMPTOSTRING. We can use this to easily query the stream for a given window of interest. For example, for the window beginning at 2018-03-21 16:21:00 we can see there were four invalid user login attempts. We can easily check the source data for this, using the ROWTIME in the above output for the window (16:21 – 16:22) as the bounds for the predicate:
ksql> SELECT ROWTIME, TIMESTAMPTOSTRING(ROWTIME, 'yyyy-MM-dd HH:mm:ss'), MESSAGE \
FROM SYSLOG_INVALID_USERS \
WHERE ROWTIME >=1521649260000 AND ROWTIME <1521649320000;
1521649272270 | 2018-03-21 16:21:12 | rpi-03 sshd[3663]: Invalid user 0 from 5.188.10.156
1521649284181 | 2018-03-21 16:21:24 | rpi-03 sshd[3667]: Invalid user 0101 from 5.188.10.156
1521649299896 | 2018-03-21 16:21:39 | rpi-03 sshd[3671]: Invalid user 1234 from 5.188.10.156
1521649311508 | 2018-03-21 16:21:51 | rpi-03 sshd[3676]: Invalid user admin from 5.188.10.156
Taking the aggregate query, we can use it to drive some exception alerting, based on a defined threshold. Let’s say we want to only know when there are four (or more) invalid user login attempts within a given window (in this case, one minute). It’s just standard SQL!
ksql> SELECT HOST,COUNT(*) AS INVALID_LOGIN_COUNT \
FROM SYSLOG_INVALID_USERS \
WINDOW TUMBLING (SIZE 1 MINUTE) \
GROUP BY HOST \
HAVING COUNT(*) >=4;
rpi-03 | 12
rpi-03 | 5
rpi-03 | 6
rpi-03 | 4
This is based on the original source stream, SYSLOG_INVALID_USERS. We could do it another route, using the table that we’d defined above and just filtering that:
ksql> SELECT ROWTIME, TIMESTAMPTOSTRING(ROWTIME, 'yyyy-MM-dd HH:mm:ss'), \
HOST, INVALID_LOGIN_COUNT \
FROM INVALID_USERS_LOGINS_PER_HOST \
WHERE INVALID_LOGIN_COUNT>=4;
1520214360000 | 2018-03-05 01:46:00 | rpi-03 | 12
1521632460000 | 2018-03-21 11:41:00 | rpi-03 | 5
1521646620000 | 2018-03-21 15:37:00 | rpi-03 | 6
1521649260000 | 2018-03-21 16:21:00 | rpi-03 | 4
The results are the same—as with the discussion above around data fidelity and premature optimisation of our data pipelines, it depends whether you also have a use for the aggregate table itself too (for example, for streaming to an analytics view), or whether you purely want to drive an anomaly detection from the source stream alone.
Let’s now populate our KSQL_NOTIFY topic with the results of the anomaly detection above:
CREATE TABLE INVALID_LOGIN_NOTIFICATIONS WITH (KAFKA_TOPIC='KSQL_NOTIFY', VALUE_FORMAT='JSON') AS \
SELECT TIMESTAMPTOSTRING(ROWTIME, 'yyyy-MM-dd HH:mm:ss') + \
        ': :heavy_exclamation_mark: On ' + \
        HOST + \
        ' there were ' + \
        CAST(INVALID_LOGIN_COUNT AS VARCHAR) + \
        ' invalid user login attempts in the last minute (threshold is >=4)' AS TEXT, \
        'general' AS CHANNEL \
FROM INVALID_USERS_LOGINS_PER_HOST \
WHERE INVALID_LOGIN_COUNT>=4;
Now we see the alerts come through, only when the threshold is breached.
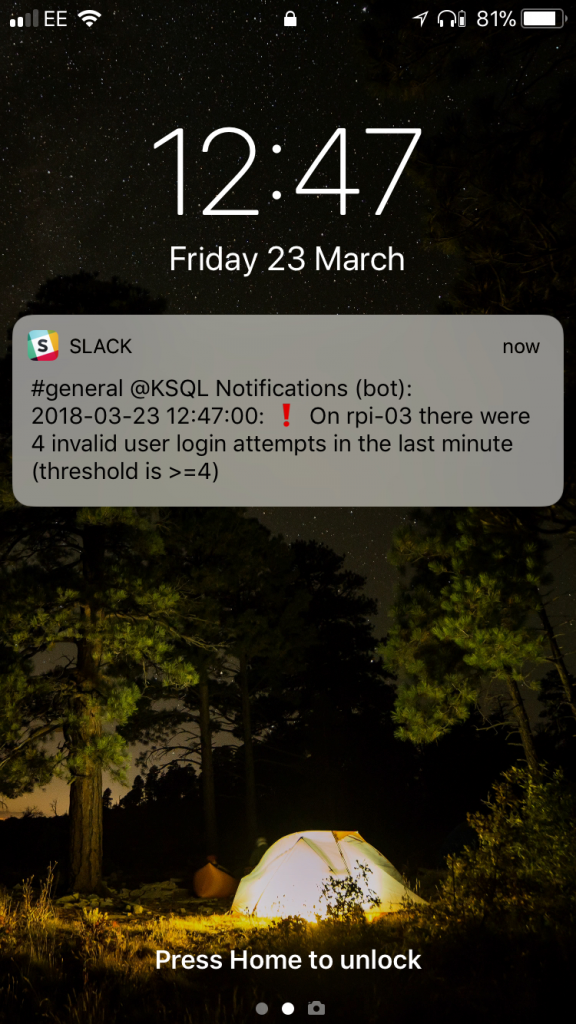
A few points to note:
- If you inspect the Kafka topic, you may notice there are null messages. These are where the original source data has expired (i.e. is outside the defined retention criteria for the topic) and KSQL has thus invalidated the aggregate for that window.
- As above, we’re using VALUE_FORMAT='JSON' so that the target topic is written to in JSON (not Avro). This is because when using Avro the message keys are written as Strings by KSQL today, not as Avro—and this causes the Python client to fail to read the message (as it expects both value and key to be in Avro—see https://github.com/confluentinc/confluent-kafka-python/issues/211)
- You may get multiple messages for the same window, if you have multiple events arriving for that window. If you want KSQL to emit fewer aggregate messages to the topic you can control this with the ksql.streams.cache.max.bytes.bufferingsetting. The higher the buffer size, the fewer aggregate messages will be sent downstream.
Monitoring KSQL Stream Processing with Confluent Control Center
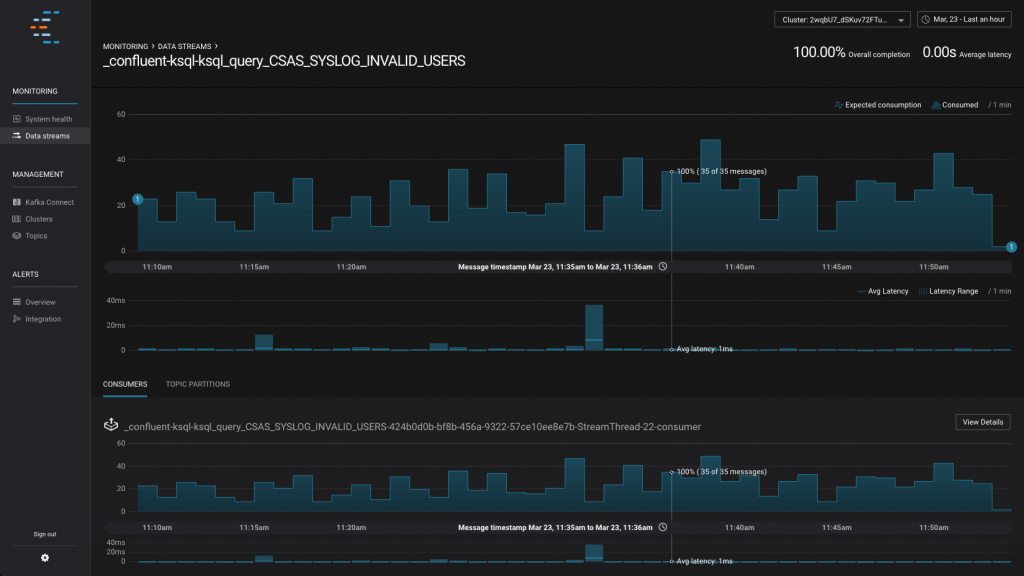
Confluent Control Center is part of Confluent Platform, and provides a GUI for monitoring both your Kafka clusters, and your streaming data pipelines running through them. Here we can see it showing the number of messages being processed by the KSQL query that’s populating the SYSLOG_INVALID_USERS stream, and the latency of this processing.
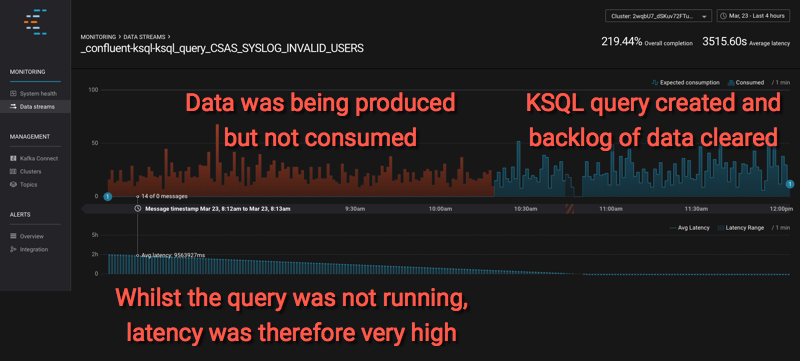
By drawing the time window back, you can also see this example here where the data was being produced (syslog events were being sent through Kafka Connect into Kafka), but the KSQL query had not yet been created. Confluent Control Center looks at the stream of data based on current consumers, of which the KSQL query filtering the data is now one—but is back-processing the data and thus the latency between the time it was produced and the time it was consumed is high:
As well as monitoring streaming data pipelines, Confluent Control Center also gives an opinionated view on the health of your Kafka cluster and topics:
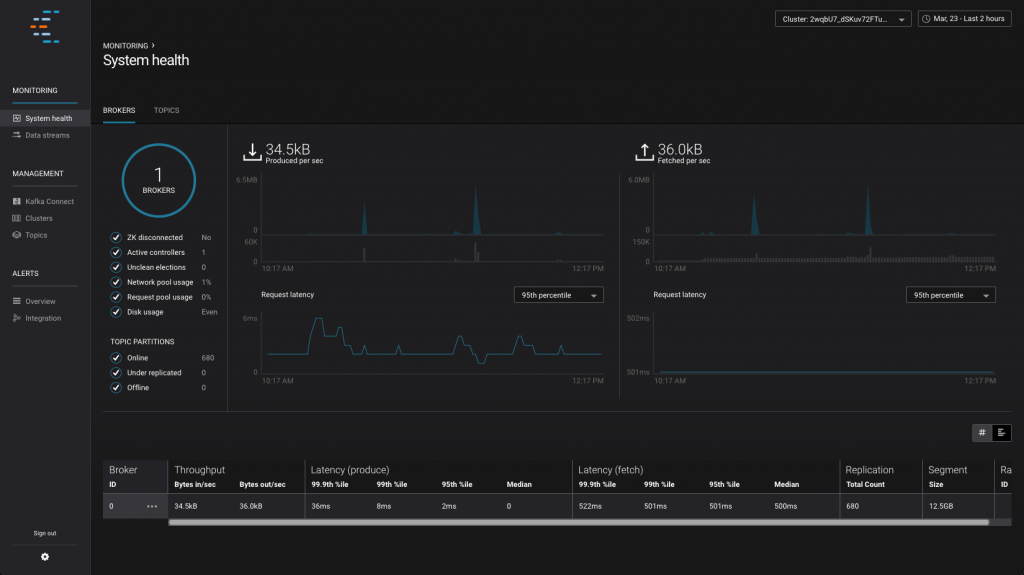
If you like what you see here then check out the videos we have of Confluent Control Center in action.
Summary & What’s Next…
KSQL gives anyone the power to write stream processing applications, using the simple declarative language of SQL. In this article we’ve shown how to build a simple application that subscribes to a Kafka topic and sends push notifications. The Kafka topic that the application monitors is populated in real time by KSQL, executing a continuous streaming query against inbound data, looking for specific criteria in the data and reformatting it for the alert. We’ve also see how the aggregation capabilities in KSQL make it easy to define thresholds for anomaly detection and drive applications through this.
In the next article we’ll return to KSQL in force, using its superpowers to join our inbound syslog data with useful data from a datastore that we can use to enrich the syslog data in realtime.
Did you like this blog post? Share it now
Subscribe to the Confluent blog
Powering AI Agents with Real-Time Data Using Anthropic’s MCP and Confluent
Model Context Protocol (MCP), introduced by Anthropic, is a new standard that simplifies AI integrations by providing a secure and consistent way to connect AI agents with external tools and data sources…

