[Virtual Event] GenAI Streamposium: Learn to Build & Scale Real-Time GenAI Apps | Register Now
Revolutionizing Failure Management in Apache Flink: Meet FLIP-304's Pluggable Failure Enrichers
TL;DR
FLIP-304 gives you the power to transform how failures are handled in Apache Flink®. With custom failure enrichers, you can tag and classify errors, integrate enriched data with monitoring tools, and quickly identify root causes.
Failures in distributed systems are inevitable, but managing them effectively makes all the difference. Enter FLIP-304: Pluggable Failure Enrichers, an upgrade that helps turn confusion into actionable insights.
Why should you care?
You’re deploying a distributed application on Apache Flink. It’s running smoothly, handling data streams like a champ. Then—a failure strikes. The only clue? A vague error message saying, “Something broke.” Not very helpful.
Traditional failure reporting in distributed systems often leaves critical questions unanswered:
Is it a code issue or an infrastructure problem?
What triggered the failure?
How can I monitor and act on similar failures in the future?
Without detailed insights, debugging becomes a time-consuming process.
Example of FLIP-304 in action
Imagine running a real-time data streaming pipeline that processes user behavior data. Suddenly, a task fails in one of the Flink jobs. The standard error message says:
Task failed: Slot 3, Operator: FilterTransformation
Cause: NullPointerException
Not very helpful. However, with a custom failure enricher, the enriched metadata reveals:
failure.type: UserErrorpriority: Highoperator: FilterTransformationslot: 3strategy: SKIP
Now you can quickly identify that the issue stems from a user-defined function in the FilterTransformation operator and prioritize the fix accordingly.
Curious how you can leverage it? Continue reading.
Enter FLIP-304: Turning failures into actionable insights
A developer encounters a crash in their Flink application and wonders, “Is this my code or an infrastructure issue?” FLIP-304 provides the answer. With pluggable failure enrichers, Flink not only lets you pinpoint failure triggers—whether it’s a coding mistake or an operational hiccup—but also supports proactive alerting. For instance, you can configure notifications to alert a specific on-call team via tools like PagerDuty if specific errors or error patterns occur, streamlining both debugging and incident response.
Step by step
Step 1: Set up the configuration
To enable FLIP-304, configure your enrichers in Flink’s settings:
Step 2: Write your custom enricher
Next, write your custom FailureEnricher implementation. Here’s a quick example:
This small snippet categorizes user-related errors and assigns them high priority. The labels hashmap object lets you tag failures with metadata like key-value pairs.
Step 3: Query enriched data
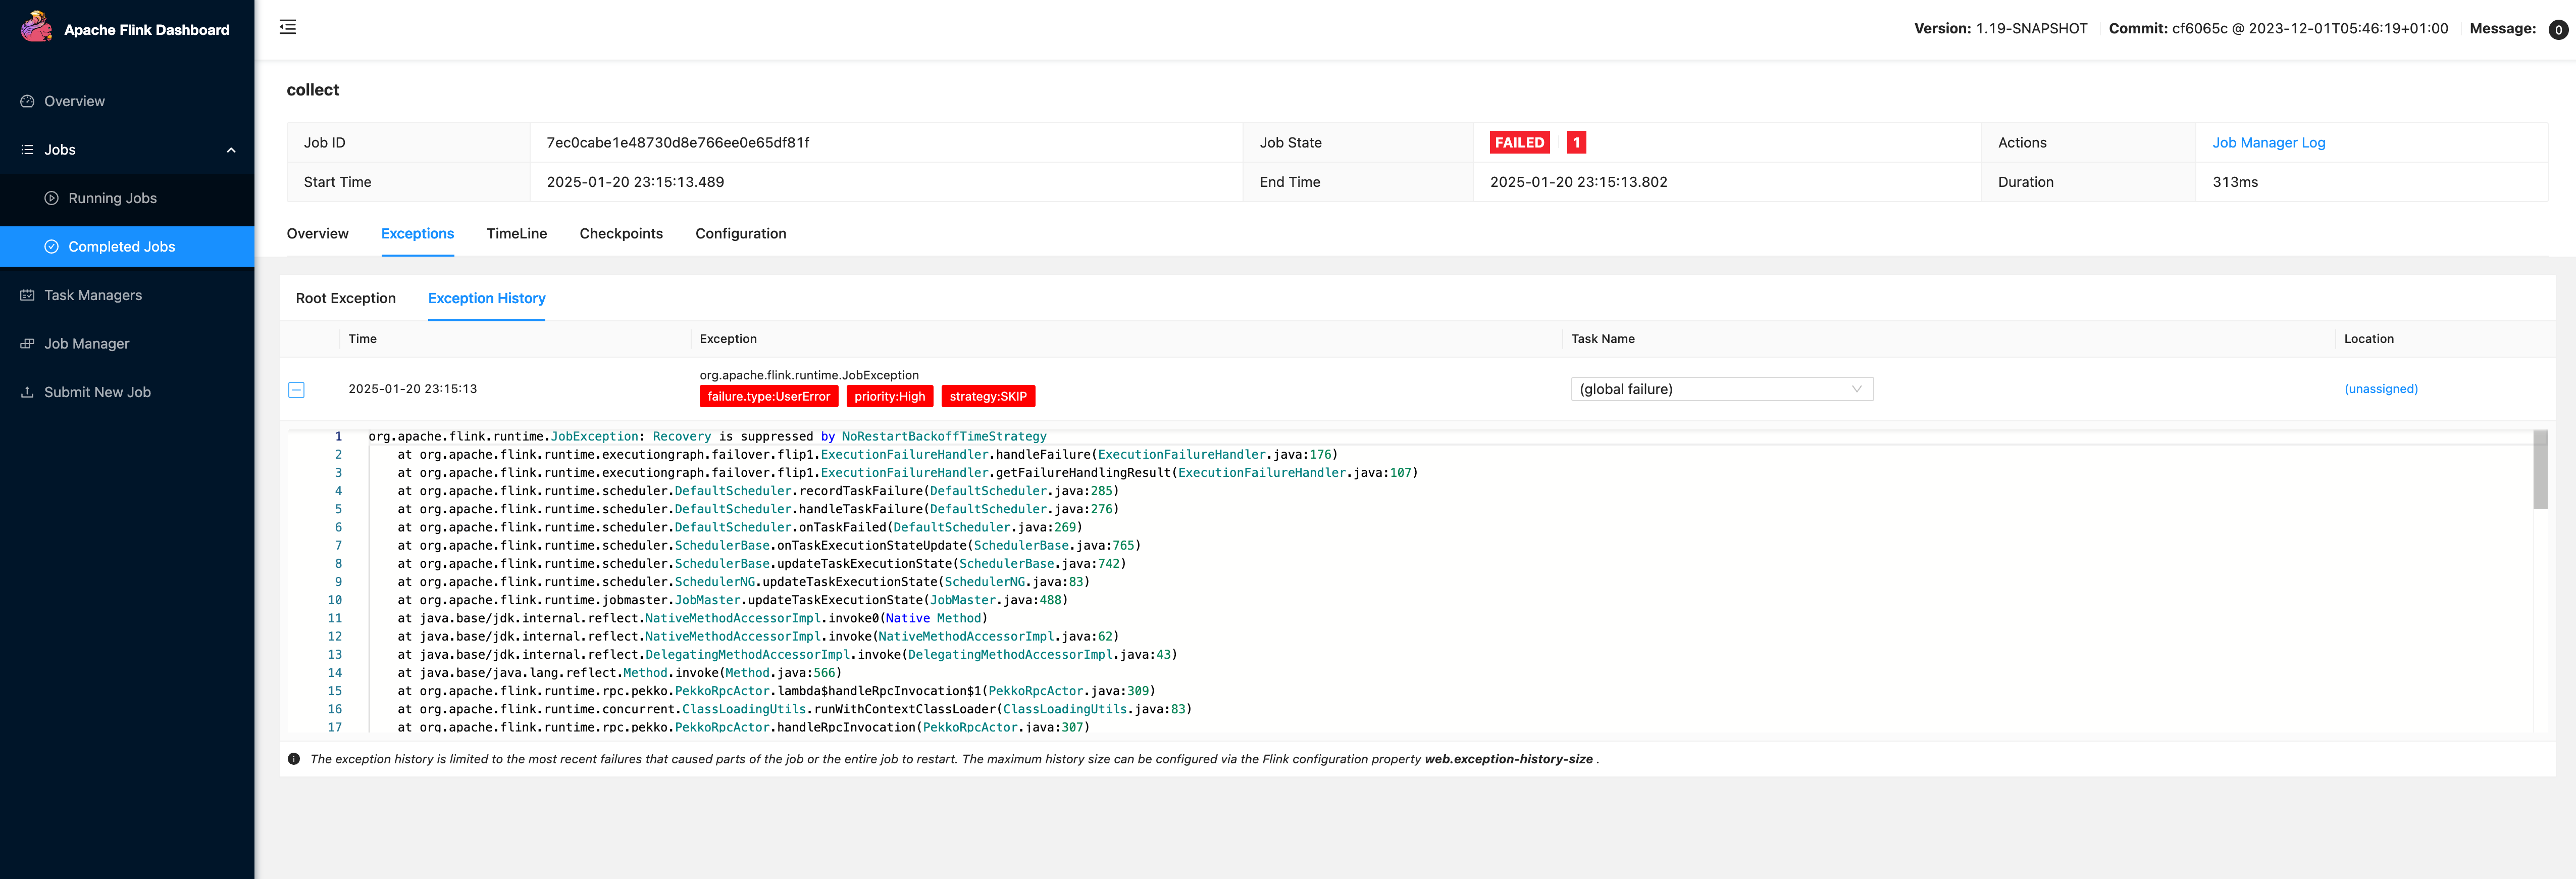
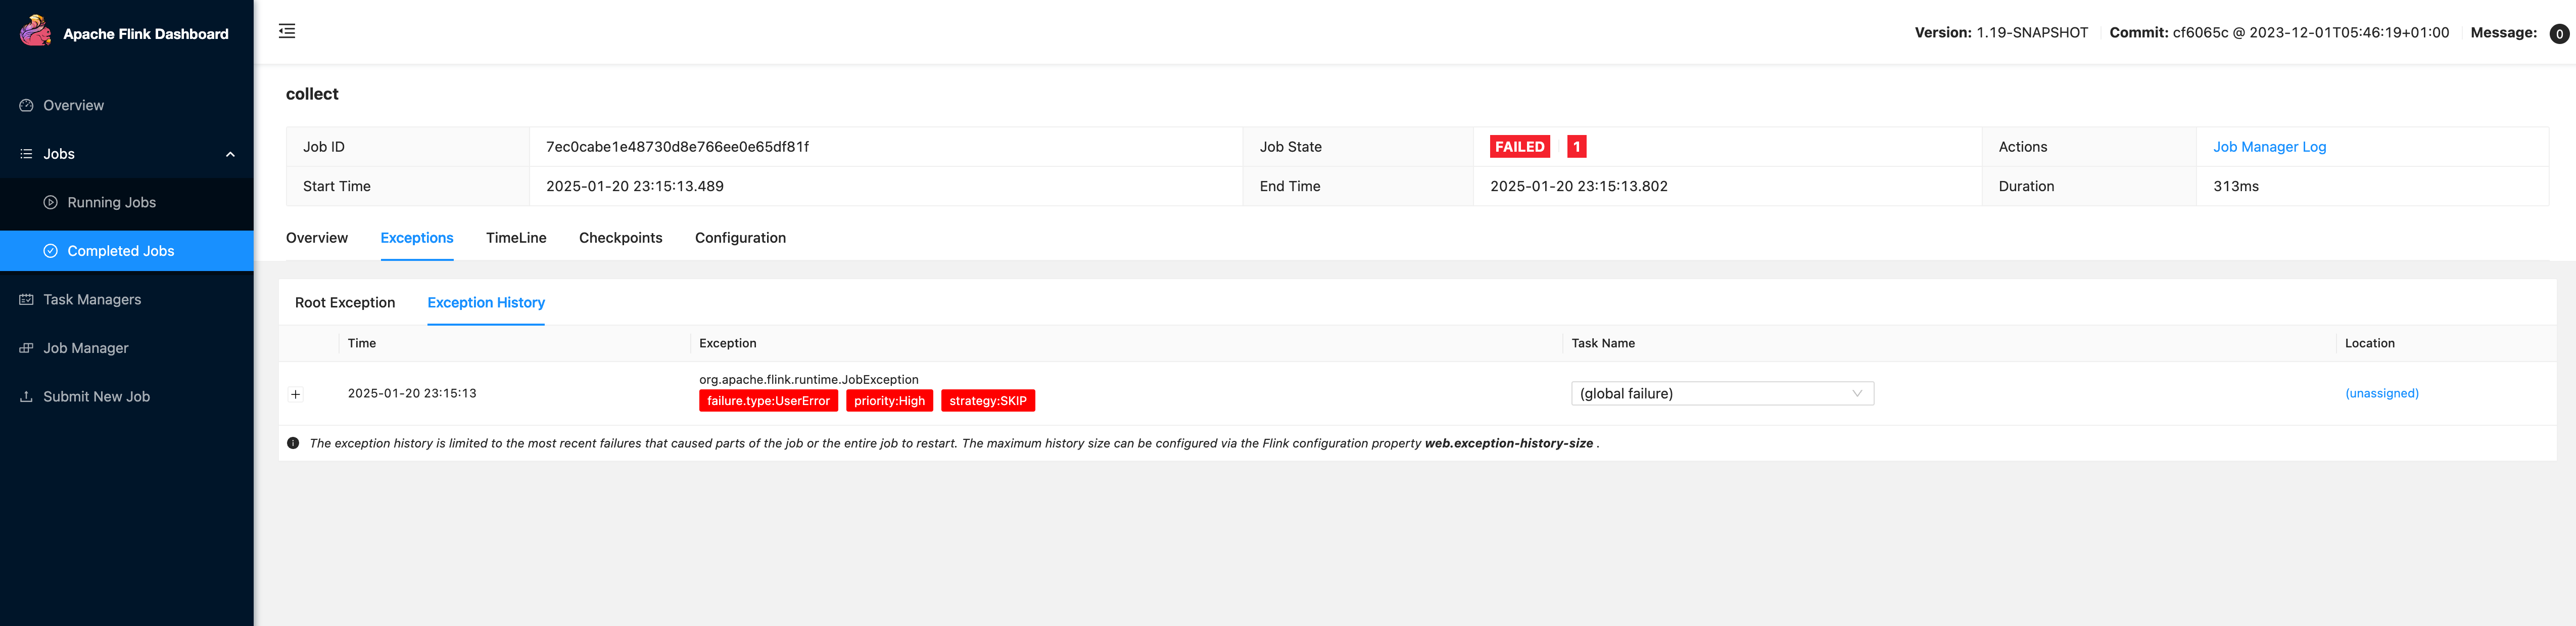
Here’s a query and response example. To see enriched exceptions, use this command:
Response example:
This enriched data integrates seamlessly with monitoring tools like Grafana, Prometheus, and Flink UI itself, giving you full visibility into your system's failures.
(right-click to open full size-image in new tab)
(right-click to open full-size image in new tab)
Why FLIP-304 matters
FLIP-304 isn’t just about making failures easier to understand—it’s about empowering you to:
Identify whether issues stem from code, infrastructure, or operations.
Use enriched data to build targeted dashboards and alerts.
Reduce debugging time and improve overall system reliability.
With FLIP-304 you can also build more sophisticated solutions through its pluggable design. For example, you can extend the failure enrichment logic with custom code to code your own Customer-Defined Error and Exception Handling Strategies. This flexibility supports additional dependencies, error types, or integration with external systems to create a dedicated response for specific scenarios. If you think about it, overall it enables you to optimize your system reliability.
Ready to start? Want to learn more?
Failures can tell you a lot—if you’re ready to listen. FLIP-304 gives you the tools to not just wake up in the night to fix an exception, but to also have the necessary insights and metadata to understand what to fix. New to Flink? Start with the basics, then explore Confluent Cloud to level up your Flink application failure management game.
Apache®, Apache Flink®, and Flink® are registered trademarks of the Apache Software Foundation.
Did you like this blog post? Share it now
Subscribe to the Confluent blog


The AI Silo Problem: How Data Streaming Can Unify Enterprise AI Agents
Salesforce has Agentforce, Google launched Agentspace, and Snowflake recently announced Cortex Agents. But there’s a problem: They don’t talk to each other…


Flink AI: Hands-On FEDERATED_SEARCH()—Search a Vector Database with Confluent Cloud for Apache Flink®
Introduction to Flink SQL FEDERATED_SEARCH() on Confluent cloud. FEDERATED_SEARCH() along with ML_PREDICT() enables developers to execute GenAI use cases with data streaming technologies.