[Webinar] AI-Powered Innovation with Confluent & Microsoft Azure | Register Now
Turning Data at REST into Data in Motion with Kafka Streams
The world is changing fast, and keeping up can be hard. Companies must evolve their IT to stay modern, providing services that are more and more sophisticated to their customers.
For this reason, event stream processing continues to grow among business cases that so far have been reliant primarily on batch data processing. In recent years, event stream processing has proven especially prominent in these three contexts:
- When performance and throughput are critical factors, and the decision-making process must take place within milliseconds: examples are cybersecurity, sports telemetry, fraud detection, safety, and artificial intelligence.
- When the business value is generated by computations on event-based data sources (data streams): examples are IoT-based data sources, such as automotive, industry 4.0, home automation applications, mobile apps, and clickstreams.
- When the transformation, aggregation, or transfer of data residing in heterogeneous sources involves serious limitations: examples are mainframe offloading, legacy systems, supply chain integration, and core business processes.
As a consulting company and Confluent partner, Bitrock helps companies design sustainable, end-to-end custom software solutions as they adapt their IT. We started an internal proof of concept (PoC) based on Kafka Streams and Confluent Platform (primarily Confluent Schema Registry and Kafka Connect) to demonstrate the effectiveness of these components in four specific areas:
- Data refinement: filtering the raw data in order to serve it to targeted consumers, scaling the applications through I/O savings
- System resiliency: using the Apache Kafka® ecosystem, including monitoring and streaming libraries, in order to deliver a resilient system
- Data update: getting the most up-to-date data from sources using Kafka
- Optimize machine resources: decoupling data processing pipelines and exploiting parallel data processing and non-blocking IO in order to maximize hardware capacity
These four areas can impact data ingestion and system efficiency by improving system performance and limiting operational risks as much as possible. This increases profit margin opportunities by providing more flexible and resilient systems.
At Bitrock, we tackle software complexity through domain-driven design, borrowing the concept of bounded contexts, and ensuring a modular architecture through loose coupling. Whenever necessary, we commit to a microservice architecture.
Due to their immutable nature, events are a great fit as our unique source of truth. They are self-contained units of business facts and also represent a perfect implementation of a contract amongst components. We’ve chosen the Confluent Platform for its ability to implement an asynchronous microservice architecture that can evolve over time, backed by a persistent log of immutable events ready to be independently consumed by clients.
This inspired us to create a dashboard that uses the practices above to clearly present processed data to an end user—specifically air traffic, which provides an open, near-real-time stream of ever-updating data. A sample of the dashboard is shown in Figure 1.
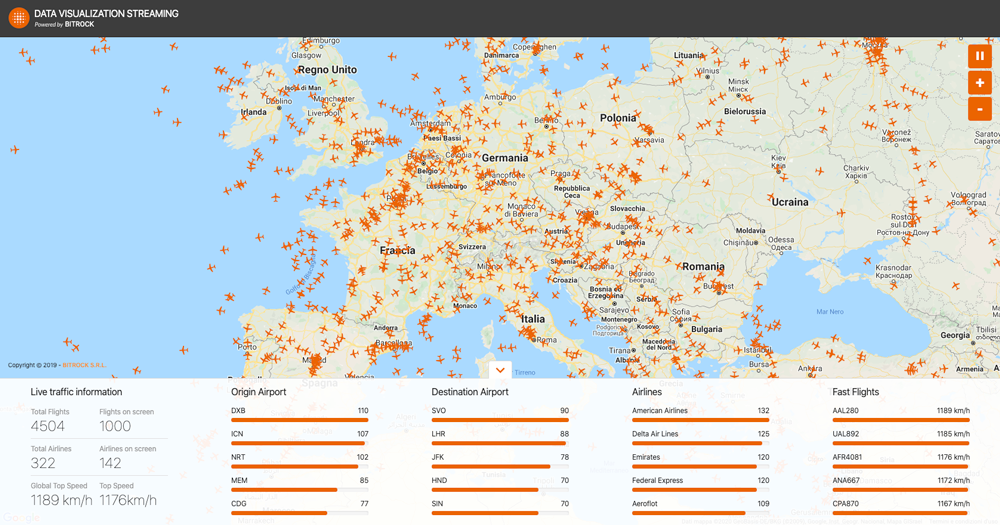
Figure 1. User interface of Data Visualization Streaming (DVS)
How we did it: The concept
Once we clearly understood the potential of Kafka, we identified a REST data source API capable of providing a large, constant, and constantly updated amount of data. After our first phase of exploring different sources, we decided to opt for the API of international flight systems. The main purpose was to create a near-real-time dashboard of data visualization and elaboration.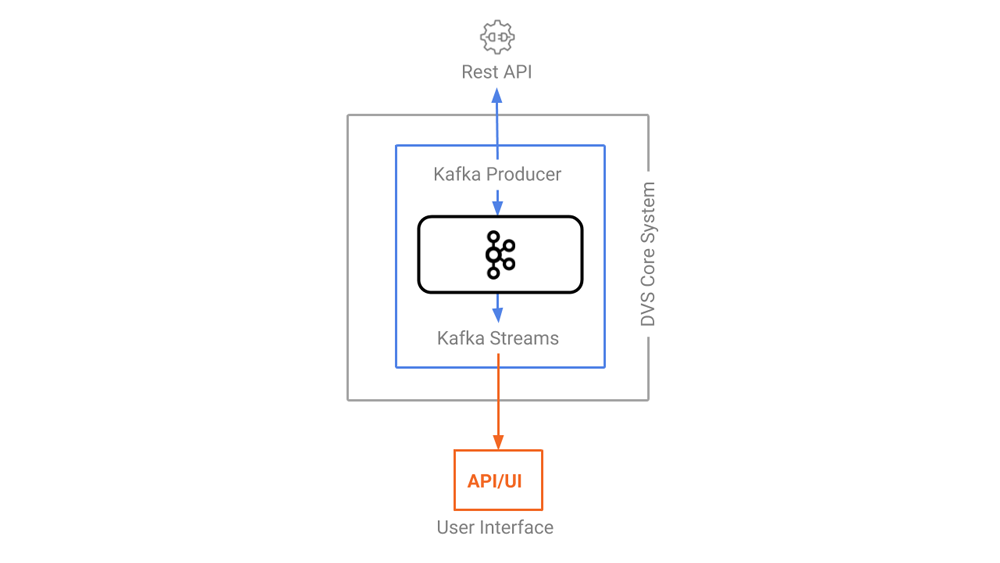
Figure 2. DVS architecture with arrows showing the direction of the dataflow
We implemented a Kafka producer to write the messages into a Kafka topic, which Kafka Streams can subscribe to, as well as use to perform aggregations and provide ready-to-use data to our clients via a WebSocket.
The world flight traffic is displayed on a geographical map in a streaming fashion where you can see, in almost real time, the airplanes moving over our heads around the globe. Just like your favorite video game, a few facts about the live global traffic are displayed in a widget, and you can engage with your friends and ask them what the most crowded airport is, the airline that delivers the fastest travel, etc. All the data is computed once from the live data and then shipped to the users as soon as it’s available.
What we did: The project architecture
The project is made of several independent components, each of which has a specific responsibility ranging from ingestion and transformation to data visualization. Choosing a message broker like Kafka as the main pillar of our architecture allows us to decouple every component from each other, increase modularity, and parallelize the work after the module interfaces have been defined.
We’ve identified three different classes of data visualization as displayed in Figure 3:
- Flight list
- A set of four different ranks: the origin airport, destination airport, airline in use, and faster flights
- Live traffic information
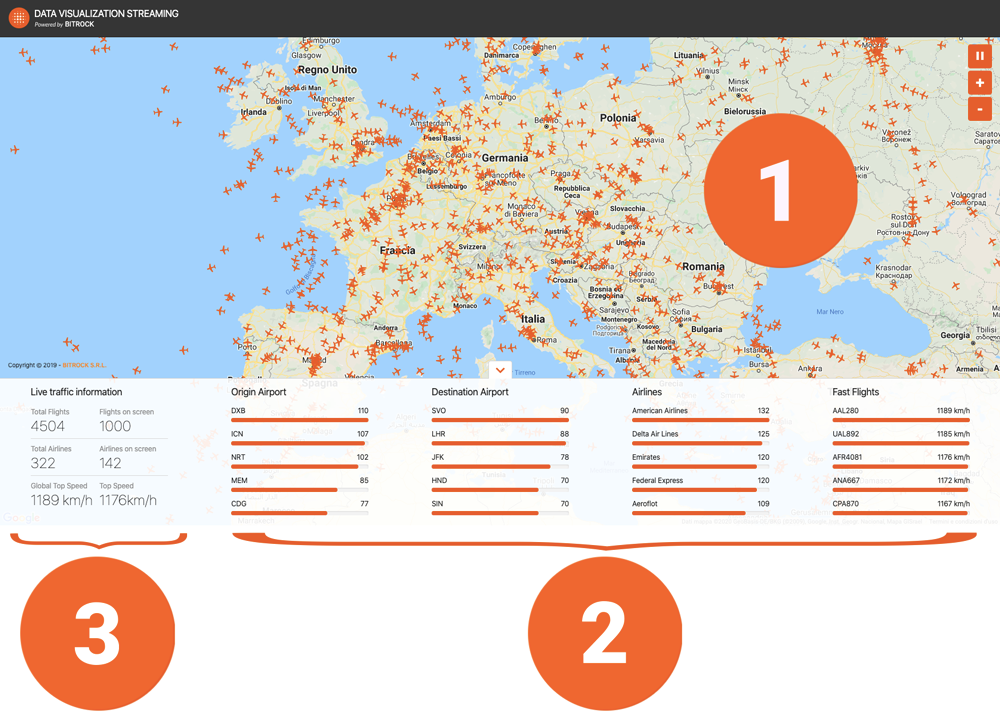
Figure 3. Classes of data visualization
Publishing events to Kafka
Every airplane is equipped with a GPS and a transponder to transmit aircraft data to air traffic controllers via HTTP calls. Kafka makes it easy to turn this unique, constrained service (in which we do not know how much payload we will get) into a full-fledged push system with backpressure support. Let’s see how.
Getting the data from your sources
The REST source to turn into a flowing stream costs $99/month for 30,000 calls.
We can design a cost-effective solution based on these criteria:
- Poll data from 5:00 a.m. CET to 6:00 p.m. CET on weekdays
- Poll flight data every 30 seconds (flight coordinates, altitude, origin airport, destination airport, schedule, etc.)
- Poll other data every six hours: airports (name, coordinates, etc.), airline (name of company, nation, flag, logo, etc.), and airplane data (airplane model, year, brand, etc.)
We considered using a connector for polling data over HTTP, but due to limits on the number of calls per month, we have to shut down our producer during non-working hours and don’t have a setting in the connector to do so. In the early stages of the project, we also considered a provider that offers a push API through a WebSocket, but the connector does not support this option.
Transforming events
Kafka Streams for event aggregation
Events are now being published into Kafka and we are ready to process them! Each widget displayed in the UI links to a specific stream of events, all managed by a Kafka Streams application.
First come the airplane records widget and the geographical map, both fed by the flight_received stream. Events in this stream are a direct transformation of the data polled from the source, joined together to enrich the raw flight data as displayed in Figure 4.
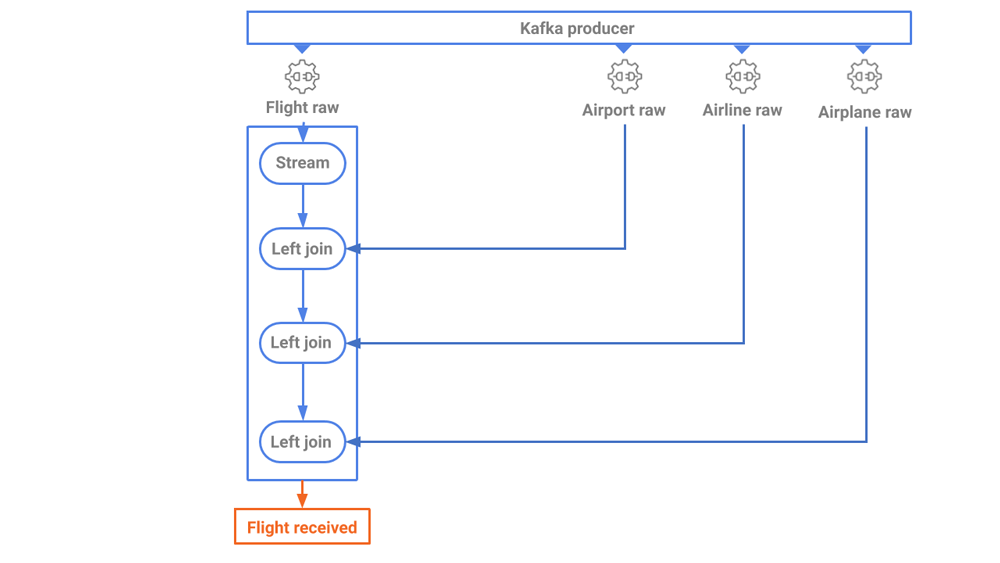
Figure 4. The first step of data elaboration
Aggregations by airline and airport are next. We’ll produce three different streams of aggregated events, each restricted to a 30-second window.
Last but not least is the top_speed stream. We can produce once again an aggregated windowed stream, this time finding the maximum speed amongst the events in a 30-second window.
Each stream shares the same source (the flight_received topic) but processes the same data, in the same order, in a different way for a different purpose. For instance, the flight_received_list stream (see Figure 5) performs aggregations on the flights in 30-second windows to gather all flights from the source and provide current snapshots of flights to its consumers, retaining only the latest of any duplicate entries. Every 30 seconds, a new snapshot is created and labeled by its creation time.
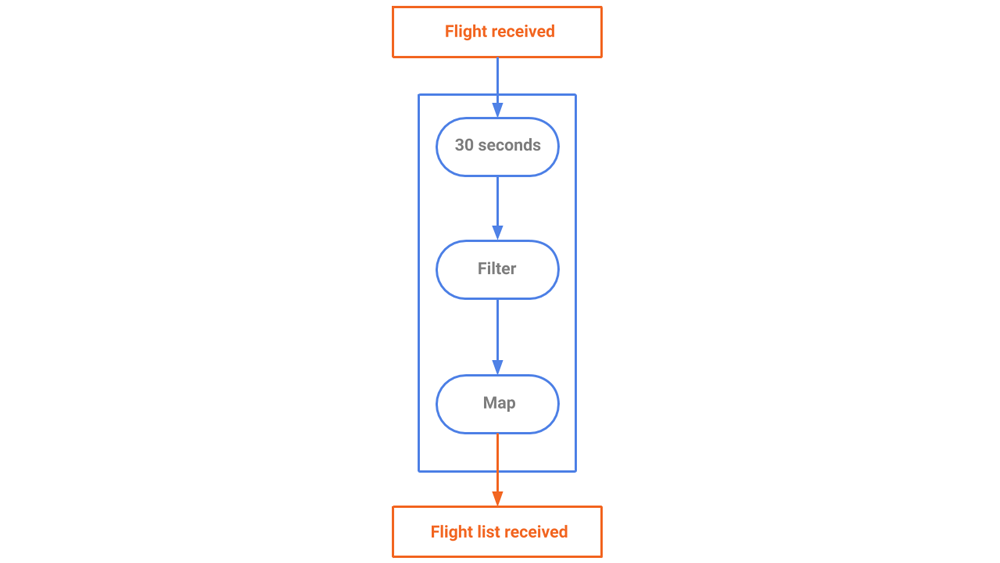
Figure 5. A stream generating a snapshot of airplanes that are currently flying
After counting the number of flights per company (as shown in Figure 6) we have to partition the data by company and count the records in each partition. We only retain the top five active companies to spare some space and memory. Aggregating the data occurs over a 30-second window.
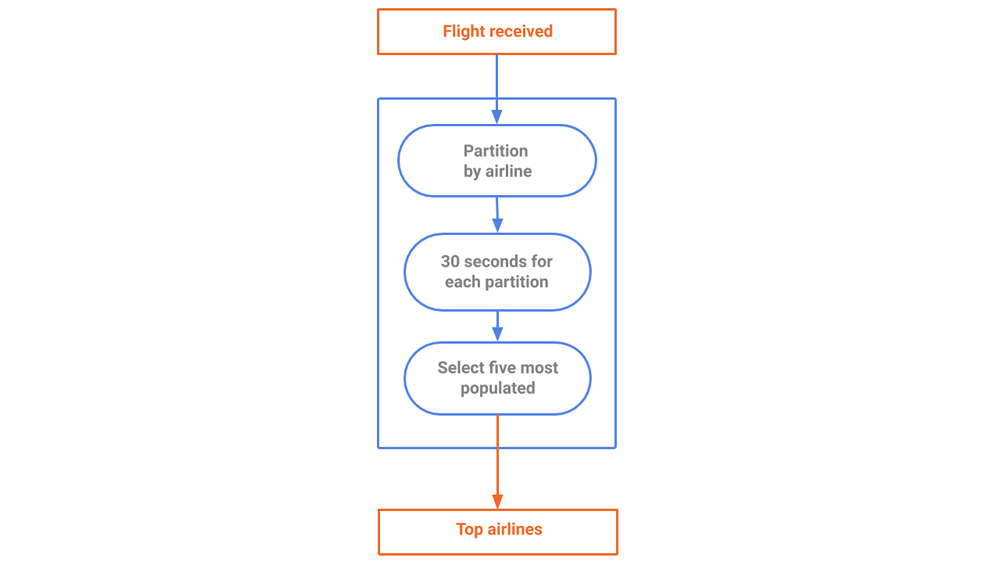
Figure 6. A stream generating a snapshot of top airlines
The process for computing the fastest airplanes in the last 30 seconds is similar. We retain only the top five results to avoid overwhelming the client with unnecessary data. The stream has been tailored to the needs of our client, so we optimize the data according to our own specs.
We can compute the number of worldwide flying airplanes as shown in Figure 7.
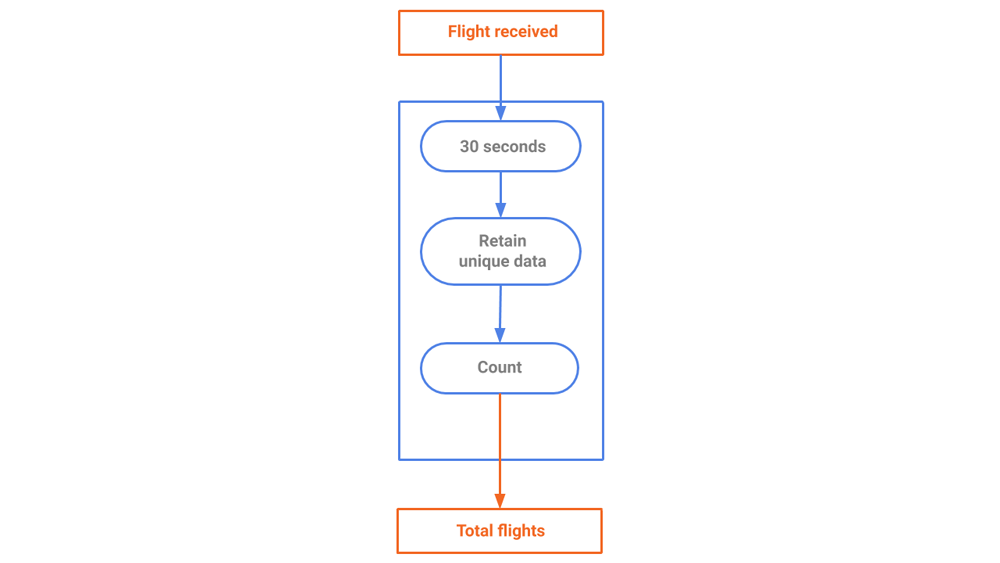
Figure 7. A stream generating a snapshot of total flights
Streaming events to a browser
Streaming APIs
To show the processing results to the user, we can build a web app with an ever-updating, near-real-time feel using a WebSocket as the main API protocol. Every widget is fed by a specific WebSocket and is thus independent.
Visualizing data in a browser

Figure 8. Data visualization panel
To deliver the final experience to the user, we build a progressive web app (PWA) that displays the data produced by the backend application through various widgets. The core choices are:
- Vue.js as the main stack (components, client-side routing, CLI, and global store) for its performance and developer experience
- TypeScript for writing more resilient code
- Google Maps as the map visualization tool
To make sure that the application has the lowest impact possible on the end user device, we follow best practices, such as code splitting and lazy loading, caching of static assets (via service workers), and handling WebSocket data in a reactive way thanks to RxJS (for more information, you can check out the blog post Consuming Messages Out of Apache Kafka in a Browser).
Each widget is responsible for fetching, loading, and rendering its own data independently to avoid computational bottleneck. This way, the global state handles only small pieces of data that need to be shared across the application.
Our design is a minimalist and user-friendly UI to make it easy to recognize updates on the screen. The basic UX patterns and components are inherited from our own Amber Design System.
If you want to view the stream on your browser, have a look at our DVS site. You can also review our codebase, which is public and free to use:
Lessons learned from DVS
Although DVS can appear as a “data manipulation” exercise at first glance, its main objective is to make the data manipulation process easier using Kafka Streams, and without complicated extract, transform, and load (ETL) processes. DVS helps us self-assess and challenge our end-to-end business skills, from functional analysis to deployment to production. The adopted architecture accelerates development times by ensuring the reliability and availability of the service, data, and scalability.
While building DVS, we discovered that the amount of data managed does not affect project execution. Processing thousands of messages per day or per minute has no impact on the implementation. This came to light when we filtered the data source to restrict the stream only to European data in order to minimize the need for debugging. Before releasing it to production, we removed the filter and performed a load test, encountering an increase of data by one order of magnitude. Once we removed the filter, our server memory consumption was only marginally affected and same for the CPU load. This is due to the zero-copy technology leveraged by Kafka.
Beyond industrial pioneers and early adopters of fintech, insurtech, and e-commerce, the opportunities for Kafka adoption are great. Consider telemetry, for instance, in which a constantly increasing amount of data is collected from onboard units or internal sensors and merged with streams of data coming from IoT platforms in smart cities. There’s also industry 4.0 scenarios, in which traditional healthcare infrastructures are evolving quickly into data-based, complex systems. Food markets too have seen their traditional supply chain evolve quickly over the last 10 years, moving to articulated platforms that enable high standards of data-driven, quality assurance, and tracking. Smart farming likewise leverages the new technological landscape.
In these and many other present and future-ready markets, event stream processing is becoming a crucial tool that allows industries to get closer to customers and enrich businesses, with the help of more sophisticated analytics platforms.
DVS project roadmap
It’s nice being able to see flights in near real time in the UI, but what if I want to see my trip from New York to Paris from yesterday? This can’t be achieved if events stream directly from the original APIs, but since we have Kafka under the hood, we can effectively replay the event streams from any point in time!
We can also find more streams of data to join together with ours. Did an airline company tweet about a flash promotion? Are you flying to Los Angeles and want to know the weather on the day of the flight? We are currently evaluating ksqlDB to help get these answers. In the meantime, if you’d like to know more, you can download the Confluent Platform to get started with a complete event streaming platform built by the original creators of Apache Kafka.
Did you like this blog post? Share it now
Subscribe to the Confluent blog
Stop Treating Your LLM Like a Database
GenAI thrives on real-time contextual data: In a modern system, LLMs should be designed to engage, synthesize, and contribute, rather than to simply serve as queryable data stores.
Generative AI Meets Data Streaming (Part III) – Scaling AI in Real Time: Data Streaming and Event-Driven Architecture
In this final part of the blog series, we bring it all together by exploring data streaming platforms (DSPs), event-driven architecture (EDA), and real-time data processing to scale AI-powered solutions across your organization.

