[Virtual Event] GenAI Streamposium: Learn to Build & Scale Real-Time GenAI Apps | Register Now
Consuming Messages Out of Apache Kafka in a Browser
Imagine a fire hose that spews out trillions of gallons of water every day, and part of your job is to withstand every drop coming out of it. This is what it is like to visualize the message throughput of Apache Kafka®.
At Confluent, we want to help developers understand how to think about event streaming and the opportunities it can create. Educating people on what an event stream looks like is a daunting task. Reading this post will give you insight into how we built a highly performant UI to solve this problem.
Traditionally, making sense of the data flowing in a distributed event streaming platform is done by charts and graphs of aggregated data. However, processing all of these messages is computationally expensive, and dropping the granularity of the data for an overview of trends is one way to make what’s happening in the data and system easier to understand. With potentially millions of messages flowing through Kafka, such high message throughput becomes the bottleneck for clients reading that data and a user’s interaction with the system. There could be thousands of machines churning through the data, but when someone tries to peer through the looking glass, it’s simply too fast to see with the naked eye.
What if there were a way to see each message at top speed, without ever having to slow them down? What if you needed to show granularity? What if you wanted to see every message inside of Kafka? Good news: It’s possible, and you can even do it in a web browser.
Pagination in Kafka for a UI
A classic interview question is: “How do you go about displaying large amounts of data in a performant way?” Most people (at least on the front end), usually come up with pagination first. An implementation for pagination might go something like this:
Out of a list of 100, request 10 items at a time until 100 items are reached. So you would do 9 requests, asking for 1–10, 11–20, etc., until the 100 are reached.
In Kafka’s case, there could be 1 million messages between successive requests, so a user can never see the “latest” message, only the range as requested by the browser. In addition, there is a fundamental problem with pagination as it relates to Kafka. Message ordering across partitions is non-deterministic, so what is displayed in the UI, a linear sequence from 1–100, would not represent the data as it is laid out inside of Kafka.
The browser will also have to parse the data that it received and render it. Depending on the payload size or throughput, the UI may be unable to handle the load.
Given this approach’s inaccuracies when it comes to displaying event streaming data, there needs to be a better solution. Since Kafka is an event streaming platform, the common option for dealing with such a problem is long polling. Long polling is a way to have long-lived HTTP connections. This gives you the real-time streaminess everybody wants, but it comes at a cost.
Long-lived HTTP requests have a large request overhead, and because requests are made often, speed becomes a problem. In order to combat the large request overhead, the kafka-rest package, which interfaces with Kafka, exposes REST endpoints and batches the messages sent into configurable one-second intervals. Because it is configurable, it’s possible to ship down blobs of stuff that are not human readable, or to only ship new data every 15 minutes, both of which would make for a painful user experience.
What we need is something that gives us a stream of data but has little request overhead.
Better, faster, stronger and then everything breaks
WebSockets not only require minimal request overhead but also provide high throughput, which solves the problem of performant message events. Because this method does not batch, the messages come to it at a real-time processing rate, and it is up to the client to deal with being performant. Instead of having to process one second at a time, a WebSocket allows us to process messages as soon as they arrive. Instead of getting large chunks of data to parse, we receive smaller chunks that can be processed faster.
In future iterations, the ability to pause, replay or stop against a WebSocket could be added. This provides greater flexibility to the types of applications that can be built, such as the ability to tell the endpoint how many messages we want to consume per second, or restarting the flow of data without needing to know about the data within the stream.
Our first attempt at WebSockets had some performance issues. It was very computationally expensive to accept a message from a WebSocket, parse it and send it into the local state store. We could only parse, update and render 10 messages/second without the browser becoming unresponsive, consuming a massive amount of system resources and eventually having to kill it though the browser’s task manager.
To speed things up, all of the other messages were left as strings and placed into a buffer. When the user asked for an update, we would switch the buffered list, parse it, render it and then refill the buffer. This minimized the degree of browser lock to semi-reasonable levels, but there would be catastrophic browser failure at around 100 messages/second.
So, we started performance testing the implementation to understand what was happening.
Too much overhead
The local state store used at Confluent is Redux. In a nutshell, Redux maintains a large JSON object and forces engineers who want to mutate data within it into a specific contract to do so. This contract has some overhead, but the benefits of having a single way to interact with store data in an application far outweigh the negatives of that overhead.
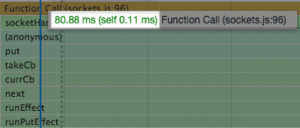
It became apparent almost immediately after looking at a WebSocket response that the overhead of firing actions in Redux was extremely expensive for our application. From the tests, a single parse, update and render took ~80 ms to execute.
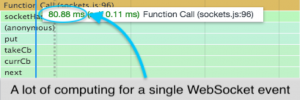
Based on the request time for a single action, ~20 messages/second is the upper bound before the browser starts showing performance degradation, and based on the test run, unrecoverable browser lockup occurs at about ~200 messages/second.
The overhead from this test indicates that there is much room for improvement in our usage of Redux. We could try to remove as much of it as possible, but there would still be some overhead. If we swapped Redux state in favor of react state, we would probably see better performance.
| Before | After |
 |
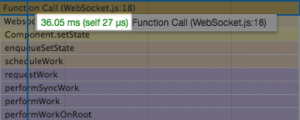 |
When the Redux portion of this feature was converted to a react component, there was a 40% decrease in JavaScript execution for most calls.
| Redux | Component |
 |
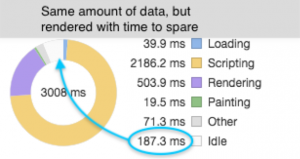 |
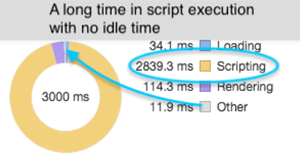
Taking a larger sample size of three seconds to get a better idea of how this helped, we saw a 26% decrease in JavaScript execution. In addition, the browser was able to get through all of the requests it was given (idle time is the indicator for this).
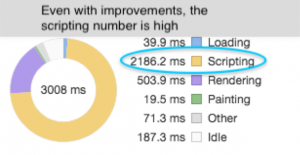
This was further optimized by batching updates to the component every six messages with shouldComponentUpdate, which produced even more performant results, as expected.
| Non-batched | Six-message batch |
 |
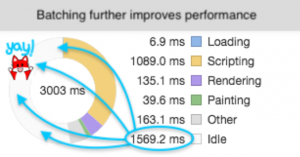 |
With the batch method, there was a 66.9% further decrease in execution. This means from Redux to this small batching, we’ve reduced the execution by 90% for the same three seconds in Redux versus batched component.
While these improvements are a significant performance gain, the UI throughput only increased by roughly 90 messages more per second before lockup, which is small relative to the many thousands of messages/second that could be flowing through a topic. This highlights the actual problem that displaying messages in Kafka presents: As message throughput increases, there needs to be a way to show those messages without UI degradation.
Even if each request takes 1 ms to complete, we will still hit the lockup of processing at 1,000 messages/second on the UI. We need a way to keep the UI lively while maximizing throughput. This was accomplished by the use of web workers.
Better, faster, stronger and then everything works
A web worker is a way to offload tasks onto a different thread in the browser. By default, JavaScript only gets a single thread, the main UI thread. Very few web pages need more than a single thread, because they don’t do that much work. All of the performance testing that’s been covered thus far happens on the main UI thread, so the lockup occurs when that single thread gets overwhelmed.
Because WebSockets have the potential to process huge amounts of data, we need a way to maintain UI responsiveness while getting as much data from it as possible. If the WebSocket is left on the main UI thread, it is guaranteed to lock up the browser, become unresponsive and crash.
With the current modifications, we went from browser lockup at ~20 messages/second to ~200 messages/second. Eventually there will be a lockup somewhere within the system, but if we can control where the lockup happens, we can recover from it if we’re using workers.
Workers operate by passing messages back and forth, and by broadcasting to event listeners that live in different sandboxes within the browser. You can think about a browser tab as a single worker. When a new tab is created from the existing one, it creates a totally separate tab that is not related to the original one. In order to get data from one place to the other, you copy/paste information from one to another. This is the same concept as a web worker—it just happens within the same browser tab programmatically.
There is one problem, however. Passing messages is expensive, so implementing web workers must be done with care. Simply passing single messages back and forth will not improve performance.
Because sending single messages between workers and parents has no performance value, we must batch. This is similar to long polling via kafka-rest, with some key differences. The first is that we are saving a lot of overhead by not using HTTP. WebSockets communicate using TCP once connected and, since the UI controls the poll interval, this method gives the greatest flexibility possible for streaming events. By batching the requests in regular intervals to get the most performance gains from the web worker, we are assured significantly better throughput on the UI.
From the previous tests, requests were locking the browser up at about 200 messages/second. We would see large chunks of script execution whenever a socket event occurred. When we take a look at the WebSocket executing inside of the web worker, we notice that the execution is drastically different. For illustration purposes, the sample test is long to better show what is happening.
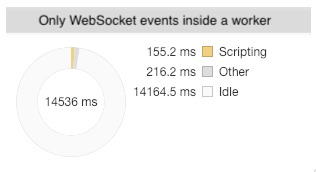
For a 14-second test, the web worker was able to parse through all events and respond in 150 ms. Looking further into the web worker, we can see microsecond responses to the messages. Previously, the WebSocket events were fighting to get computation time against the main UI thread. Scroll events, rendering and garbage collection no longer affect the performance. The only execution occurring in the web worker are the WebSocket events.

When all 1,200 messages are sent back to the main UI thread, the rendering performance is fast as expected, at 12 ms per message.

We can now see the huge upside of having the WebSocket inside the worker. We are able to process much larger amounts of data while still keeping render times fairly low. And, as we can tell by the idle time inside the worker, we can handle significantly more messages, even beyond what the test shows here.
Chugging from the firehose
We started with a single WebSocket message event that took 80 ms and reduced it to 12 ms rendering, in addition to not locking up the UI. That’s a difference of 147%!
With all the idle time in the socket, there seems to be a very high upper bound for a method like this. Once we reach a high enough WebSocket throughput, however, lockup should also occur inside the worker. The UI would still be usable at this point, but the web worker could cause problems.
In an effort to max this out, we found that throwing 5,000 messages per second at WebSocket plus worker method results in ultrahigh CPU utilization of 290–300% and locks up the web worker. Since the worker has locked up with execution, there is no recourse except for killing the offending web worker. The only way to kill the worker is to close the tab. Even with everything having gone wrong and fans blazing like the computer is trying to lift off, the UI is still responsive, but the damage and usage of the user’s computer is pretty undesirable.
A possible, albeit controversial solution, to this problem is to start dropping messages out of the socket event. While this will not be factually accurate for someone trying to view all messages passing through a topic/stream, this will prevent lockup, allowing us to gracefully shut down the web socket when desired and alert the user that we’re in a degraded state due to the throughput.
Here is the result of that test:
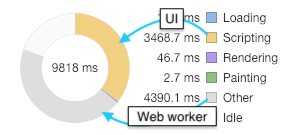

The main UI thread is in yellow and the worker in gray.
We can see that a huge amount of time and CPU usage is being spent by the worker. Most of the large blocks on the main thread are from other XHR requests on the page. The sections where the messages are parsed indicate that it takes roughly 250 ms to render about 300 messages. The reduced number of messages is due to the throttle. Given linear performance, at 7,500 messages per batch, the UI will lock up when it attempts to render a payload that large. In order to reach that throughput, Kafka needs to be processing 125,000 messages per second.
Next steps
If you think that the UI handling 200% more messages from Kafka is substantially better, keep in mind that it can still go well beyond what can be handled currently. If the throughput of a specific stream is factored in, we would have the ability to dynamically throttle and/or decrease/increase the batching, or send pause events to the server in order to allow the worker to catch up. For slower throughput topics, no throttle is necessary. For millions of messages per second or for enormous messages, a large throttle and possibly increased delay for rendering might be required.
Another thing to look at would be the Redux performance. It is possible that there are suboptimal patterns within our Redux usage that could be looked at and fixed, speeding up the entire application.
We can also gain substantial performance boosts by increasing the number of workers to share the load. Currently, we are relegated to a single endpoint for message delivery. If that endpoint were split, it would be possible to scale up the number of workers and sockets, and have each of them respond back to the main thread. We could then leverage React’s asynchronous rendering for even higher throughput while still maintaining responsiveness.
So why did we do all of this? First and foremost, the first version of the message browser was very limited due to performance. While it worked within the confines of a limited number of messages, as most existing message browsers do, but is a poor representation of the capabilities of Kafka. We’ve gained so much performance, that we’re now able to give users a better visual understanding of what is happening inside Kafka and Kafka streams, as well as the ability to filter, sort and search through processed messages, which was not possible with the limited number before.
In other news, we are hiring front end engineers and full stack engineers! Come join our amazing team and work for one of the fastest-growing enterprise companies out there!
Did you like this blog post? Share it now
Subscribe to the Confluent blog
Powering AI Agents with Real-Time Data Using Anthropic’s MCP and Confluent
Model Context Protocol (MCP), introduced by Anthropic, is a new standard that simplifies AI integrations by providing a secure and consistent way to connect AI agents with external tools and data sources…

