[Webinar] AI-Powered Innovation with Confluent & Microsoft Azure | Register Now
Building a Telegram Bot Powered by Apache Kafka and ksqlDB
Imagine you’ve got a stream of data; it’s not “big data,” but it’s certainly a lot. Within the data, you’ve got some bits you’re interested in, and of those bits, you’d like to be able to query information about them at any point. Sounds fun, right? Since I said “stream of data”—and you’re reading this on a blog about Apache Kafka®—you’re probably thinking about Kafka, and then because I mentioned “querying,” I’d hazard a guess that you’ve got in mind an additional datastore of some sort, whether relational or NoSQL.
But what if you didn’t need any datastore other than Kafka itself? What if you could ingest, filter, enrich, aggregate, and query data with just Kafka? With ksqlDB we can do just this, and I want to show you exactly how.
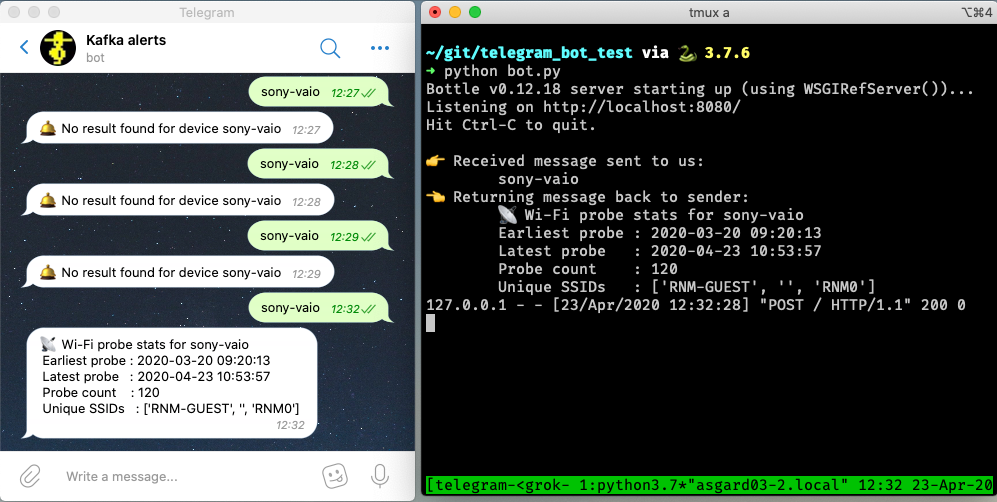
We’re going to build a simple system that captures Wi-Fi packets, processes them, and serves up on-demand information about the devices connecting to Wi-Fi. The “secret sauce” here is ksqlDB’s ability to build stateful aggregates that can be directly accessed using pull queries. This is going to power a very simple bot for the messaging platform Telegram, which takes a unique device name as input and returns statistics about its Wi-Fi probe activities to the user:
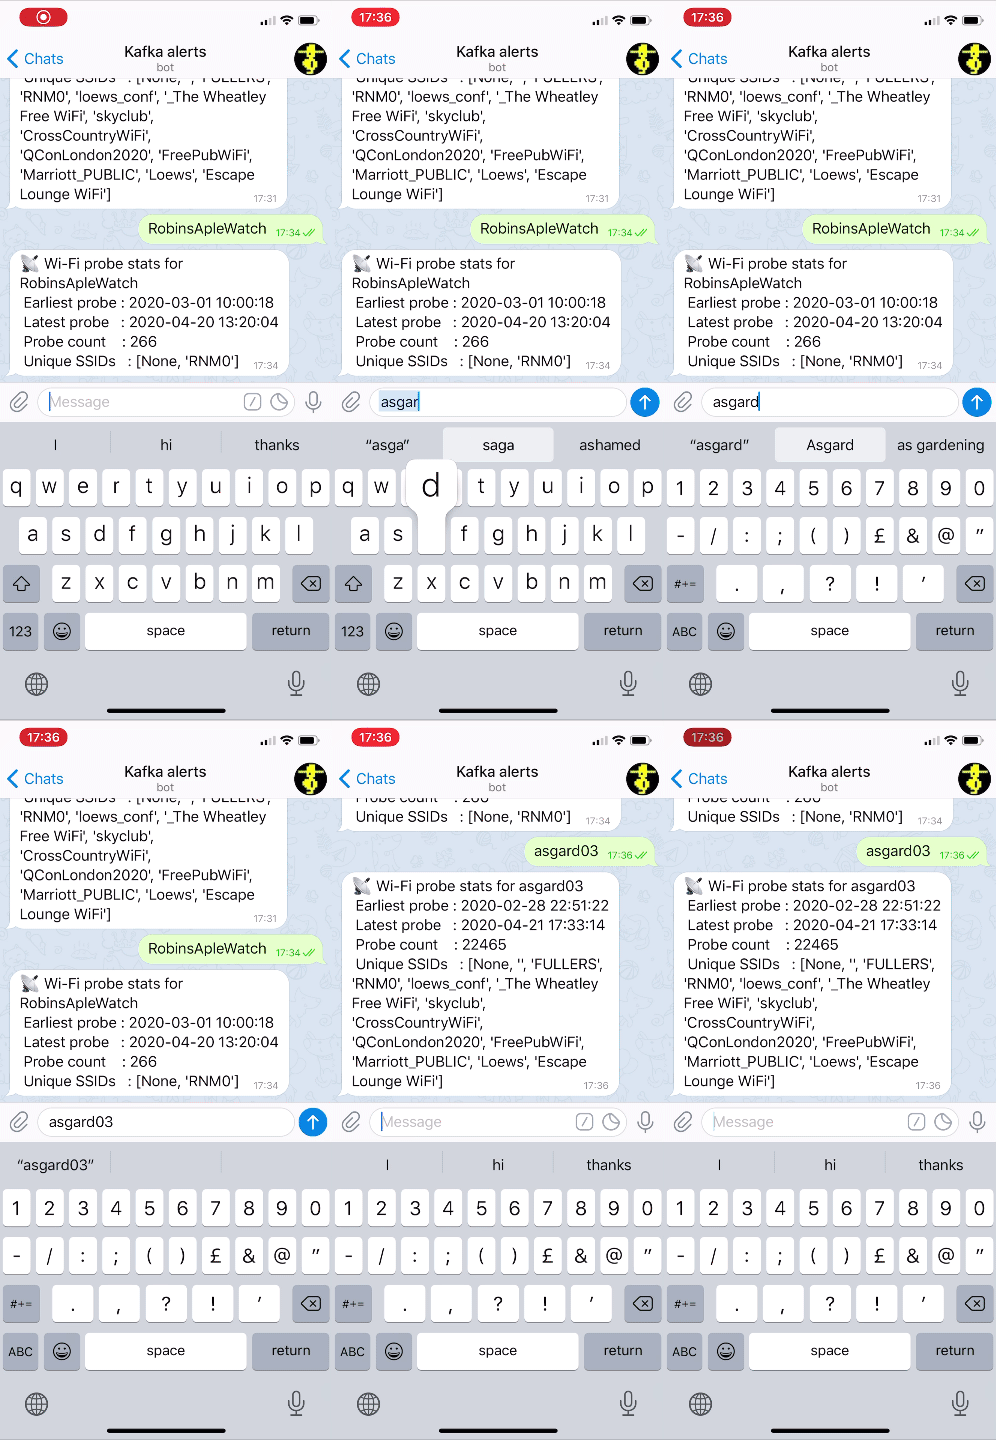
The overall architecture looks like this:

Turning a stream into state
The data comes from Wireshark and is streamed to Kafka (provided by Confluent Cloud). The raw Kafka topic looks like this:
First, we declare a schema on it in ksqlDB with a STREAM:
CREATE STREAM PCAP_RAW (timestamp                    BIGINT,
                        wlan_fc_type_subtype         ARRAY,
                        wlan_radio_signal_dbm        ARRAY,
                        wlan_sa                      ARRAY,
                        wlan_ssid                    ARRAY)
    WITH (KAFKA_TOPIC ='pcap',
          VALUE_FORMAT='JSON',
          TIMESTAMP   ='timestamp');
From this, we can materialise state to answer questions such as:
- How many Wi-Fi probes have there been for each device?
- When was the first probe?
- When was the last probe?
Since we’re dealing with state (“what’s the value for this key?”) and not a stream (an unbounded series of values, which may or may not have a key), this is a TABLE object in ksqlDB:
CREATE TABLE PCAP_STATS_01 AS
    SELECT WLAN_SA[1]                                                  AS SOURCE_DEVICE
          ,COUNT(*)                                                    AS PROBE_COUNT
          ,TIMESTAMPTOSTRING(MIN(ROWTIME),'yyyy-MM-dd HH:mm:ss','Europe/London') AS FIRST_PROBE
          ,TIMESTAMPTOSTRING(MAX(ROWTIME),'yyyy-MM-dd HH:mm:ss','Europe/London') AS LAST_PROBE
          ,COUNT_DISTINCT(WLAN_SSID[1])                                          AS UNIQUE_SSIDS_PROBED
          ,COLLECT_SET(WLAN_SSID[1])                                             AS SSIDS_PROBED
    FROM PCAP_RAW
    WHERE wlan_fc_type_subtype[1]=4
    GROUP BY WLAN_SA[1];
Now we can query this table to find out the current state:
SELECT PROBE_COUNT, FIRST_PROBE, LAST_PROBE, UNIQUE_SSIDS_PROBED, SSIDS_PROBED
  FROM PCAP_STATS_01
 WHERE ROWKEY='a4:83:e7:4e:39:15';
+------------+--------------------+--------------------+--------------------+-----------------------------------+
|PROBE_COUNT |FIRST_PROBE         |LAST_PROBE          |UNIQUE_SSIDS_PROBED |SSIDS_PROBED                       |
+------------+--------------------+--------------------+--------------------+-----------------------------------+
|178         |2020-04-18 17:04:27 |2020-04-22 14:43:40 |10                  |[, RNM0, FULLERS, skyclub, FreePubW|
|            |                    |                    |                    |iFi, _The Wheatley Free WiFi, Cross|
|            |                    |                    |                    |CountryWiFi, Marriott_PUBLIC, QConL|
|            |                    |                    |                    |ondon2020, Loews]                  |
Pretty neat, right?
Taking a brief peek under the covers
So what’s going on here? It turns out that Kafka is not just a pretty face, nor is it just a highly scalable message broker. It’s also a platform with APIs for integration (Kafka Connect) and stream processing (Kafka Streams). Combined with ksqlDB, we can write SQL statements to take a Kafka topic and apply stream processing techniques to it such as:
- Filtering rows (predicates)
- Filtering columns (projection)
- Schema manipulation
- Joining to other topics
- Aggregations
- Type conversions
But where’s it all stored? Normally, we’d be off to a NoSQL store or RDBMS to write this data out before an application can query it. Turns out, Kafka is a great place to store data (particularly with recent developments in Tiered Storage for data in Kafka). Kafka is distributed, scalable, and fault tolerant, and ksqlDB uses it as the persistent store for any tables (or streams) that are populated within it.
ksqlDB also uses RocksDB to build a local materialised view of the data held in the tables and aggressively caches this in memory. ksqlDB is also a distributed system and can run clustered across multiple nodes—and RocksDB will do the same. In a rather clever design, ksqlDB maintains a changelog for RocksDB in a Kafka topic as well—so if a node is lost, its state can be rebuilt directly from Kafka. Thus, Kafka is our primary and only system of record that we need in this scenario.
ksqlDB supports the ability to query a state store in RocksDB directly, and that’s what we saw above in the SELECT that we ran. If you’re familiar with Kafka Streams (on which ksqlDB is built), then you’ll recognise this functionality as interactive queries.
Querying state from a Kafka stream is insanely useful
There is an aphorism in the stream processing world:
Life is a stream of events
Put into more concrete terms: most of what happens around us and in the businesses for which we’re building systems usually originates as an event. Something happened. These “things” may well get batched up as part of the implementation detail of how they are stored and processed, but fundamentally, they occur as an unbounded (never-ending) series of things. It makes a lot of sense, then, to consider building a system around this model of events because it gives us the low-latency and semantic models that we need when dealing with this data.
Put another way, events are the lowest granularity of most data that we work with in our systems, and just as you can’t go back from a low-fidelity replica to the original, the same happens with our data. As soon as we roll it up and store it as a lump of state in a database, we lose all the benefit of the events underneath. Those benefits include event-driven applications and the analysis of behaviours within a stream of events.
If we agree that first capturing the changes that happen around us as a stream of events is a good idea, then we need to think about how we build systems around this. At one end of the scale, we have the classic kind of ad hoc analytics and static reporting that is invariably going to be driven from data in a store such as Amazon S3, Snowflake, or a suitable RDBMS. Kafka can stream events into these systems with Kafka Connect, so there’s no problem there. At the other end of the scale, we have applications that are going to be driven by these events, and subscribing to Kafka topics is the perfect way to do that.
But what about applications that aren’t event driven and aren’t analytics—those in between that still need to work with the data that we have from the original events, but that need this data materialised as state? Instead of an event-driven application that simply responds when an order is placed, we want another application to be able to look at “how many orders have been placed for a given customer” or “what was the total sales of a given item in the last hour.”
We can build this using Kafka and ksqlDB. ksqlDB allows you to define materialised views on top of a stream of data, which are available to query at low latency. ksqlDB uses SQL to declare these, and once the view is declared, any application can use the REST API to query it.
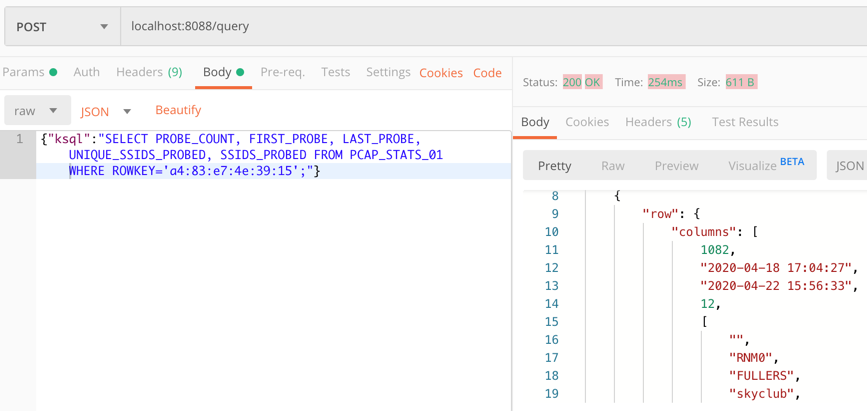
Building a Telegram bot with Kafka and ksqlDB
Telegram is a messaging platform, similar in concept to WhatsApp, Facebook Messenger, and so on. It has a nice Bot API, which we’re going to use here. I’ve drawn heavily on this tutorial for the foundations of this bot. It’s 💯 a proof of concept, so do take it with a pinch of salt. Whilst I’m using Telegram for this article, this same approach would work just fine with a bot on your own platform of choice (Slack, etc.) or within your own standalone application that wants to look up state that’s being populated and maintained from a stream of events in Kafka.
You first need to set up a Telegram bot, which I cover in detail already in this blog post. Once you’ve set up the Telegram bot, you need to run your code, which is going to provide the automation. We’re building a very simple example—someone sends a device name to the bot in Telegram, and it replies with the various statistics about the device. To enable the bot’s code to receive these messages, we’ll use the webhook API, which pushes the message to our local code. Since this is all just running on a laptop at home, we need to be able to listen for the inbound communication, and an easy way to do that is with ngrok. Set up an account, download the small executable, and configure it with the auth token you receive when you sign up, and then run it for port 8080:
./ngrok authtoken xxxxyyyy
./ngrok http 8080
This gives you a temporary public URL that will forward traffic to your local laptop.
ngrok by @inconshreveable                                                   (Ctrl+C to quit)

Session Status                online
Account                       rmoff42 (Plan: Free)
Version                       2.3.35
Region                        United States (us)
Web Interface                 http://127.0.0.1:4040
Forwarding                    http://272a201c.ngrok.io -> http://localhost:8080
Forwarding                    https://272a201c.ngrok.io -> http://localhost:8080

Connections                   ttl     opn     rt1     rt5     p50     p90
                              0       0       0.00    0.00    0.00    0.00
Taking that URL (http://272a201c.ngrok.io in the example above), we register it with Telegram as the webhook for our bot:
curl -L http://api.telegram.org/bot/setWebHook?url=https://272a201c.ngrok.io
The final piece to the puzzle is the actual bot code itself, which is going to receive the message sent to the Telegram bot and do something with it.
You can find the full code on GitHub, but the salient snippets are where we take an inbound message, process it, and reply:
def post_handler(self):
    data = bottle_request.json
    answer_data = self.prepare_data_for_answer(data)
    self.send_message(answer_data)
Here’s the actual lookup against the ksqlDB REST API:
def lookup_last_probe(self,machine):
    ksqldb_url = "http://ksqldb-server.acme.com:8088/query"
    headers = {'Content-Type':'application/vnd.ksql.v1+json; charset=utf-8'}
        query={'ksql':'SELECT PROBE_COUNT, FIRST_PROBE, LAST_PROBE, UNIQUE_SSIDS_PROBED, SSIDS_PROBED FROM PCAP_STATS_01 WHERE ROWKEY = \''+device+'\';'}

        r = requests.post(ksqldb_url, data=json.dumps(query), headers=headers)

        if r.status_code==200:
            result=r.json()
            if len(result)==2:
                probe_count=result[1]['row']['columns'][0]
                probe_first=result[1]['row']['columns'][1]
                probe_last=result[1]['row']['columns'][2]
                unique_ssids=result[1]['row']['columns'][3]
                probed_ssids=result[1]['row']['columns'][4]

                return('📡 Wi-Fi probe stats for %s\n\tEarliest probe : %s\n\tLatest probe   : %s\n\tProbe count    : %d\n\tUnique SSIDs   : %d (%s)' % (device, probe_first, probe_last, probe_count, unique_ssids, probed_ssids))
        else:
            return('🛎 No result found for device %s' % (machine))
    else:
        return('❌ Query failed (%s %s)\n%s' % (r.status_code, r.reason, r.text))
Note: This is a proof of concept. The code above fell out of the ugly tree and hit every branch on the way down for sure, but hey, it works 😉
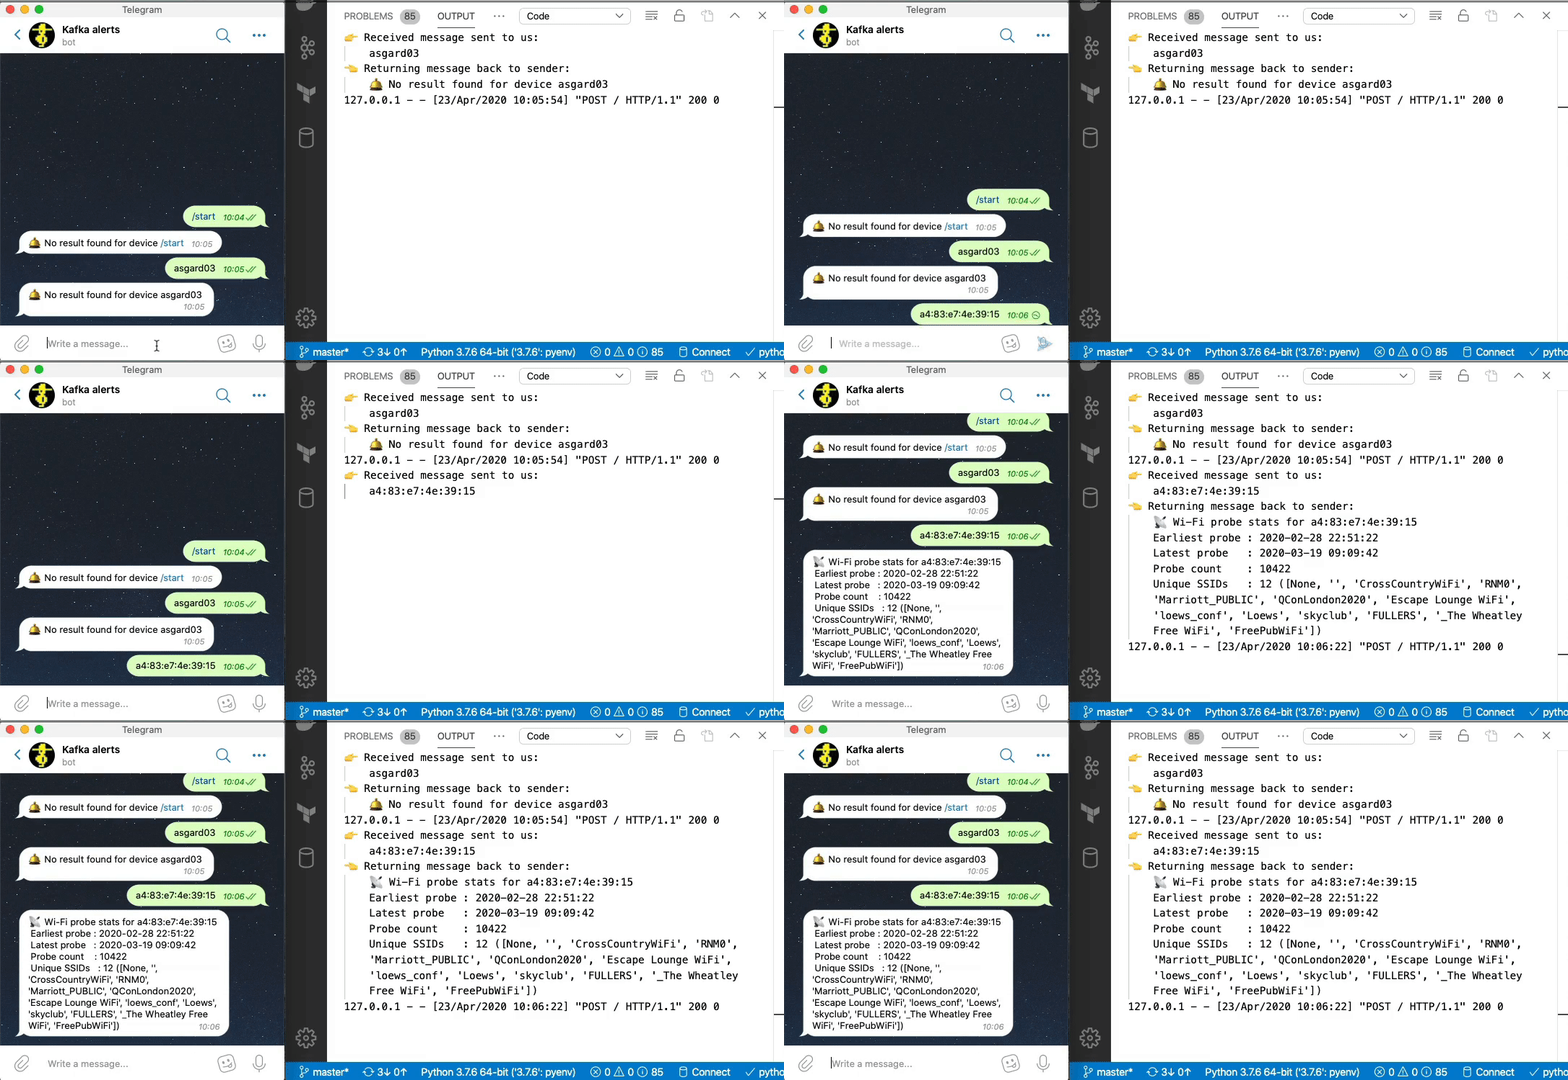
Now we can send a message to our Telegram bot and get a reply based on a direct lookup of state from ksqlDB:
Enriching streams of data with lookups
What we’ve built so far is already rather useful. We’ve simplified our architecture, and we’re about to do so again, because what data truly lives in isolation in this world? Much of the data that we pass around is normalised to an extent, and thus when it comes to presenting it back to a human being, it benefits from a degree of denormalisation. We don’t have to go the whole hog, but simple touches like resolving a MAC address to a device name is pretty handy, so let’s do that here.
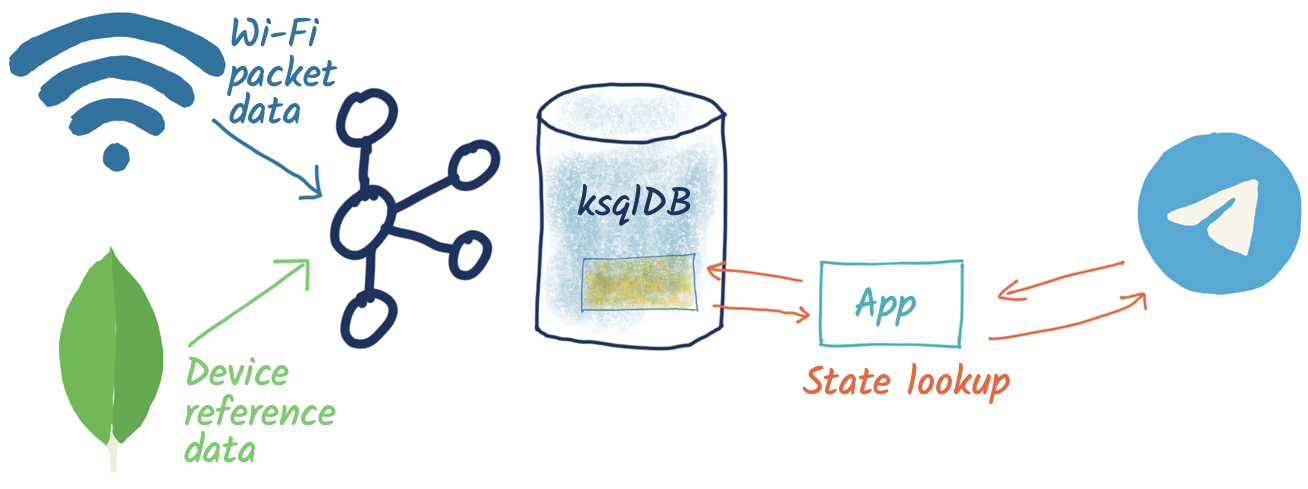
The source of our lookup data is MongoDB, and instead of calling out to it each time, we just replicate it as a local cache within Kafka and ksqlDB:
CREATE SOURCE CONNECTOR SOURCE_MONGODB_01 WITH (
    'connector.class' = 'io.debezium.connector.mongodb.MongoDbConnector',
    'mongodb.hosts' = 'rs0/mongodb:27017',
    'mongodb.name' = 'unifi',
    'collection.whitelist' = 'ace.device, ace.user'
);
Now we have a snapshot of everything in the specified MongoDB collections, as well as every subsequent change to the data in MongoDB. The data that we get from MongoDB is the raw JSON, so we first treat it as a stream (because we want to process each message that comes through as its own event) in order to apply processing that gets it into the form that we need:
-- Extract device data fields from JSON payload
CREATE STREAM DEVICES_RAW WITH (KAFKA_TOPIC='unifi.ace.device', VALUE_FORMAT='AVRO');
SET 'auto.offset.reset' = 'earliest';
CREATE STREAM ALL_DEVICES AS
        SELECT  'ace.device'                       AS SOURCE,
                EXTRACTJSONFIELD(AFTER ,'$.mac')   AS MAC,
                EXTRACTJSONFIELD(AFTER ,'$.ip')    AS IP,
                EXTRACTJSONFIELD(AFTER ,'$.name')  AS NAME,
                EXTRACTJSONFIELD(AFTER ,'$.model') AS MODEL,
                EXTRACTJSONFIELD(AFTER ,'$.type')  AS TYPE,
                CAST('0' AS BOOLEAN)               AS IS_GUEST
        FROM    DEVICES_RAW
        -- Set the MAC address as a the message key
        PARTITION BY EXTRACTJSONFIELD(AFTER ,'$.mac')
        EMIT CHANGES;
Now we transform this stream into a table, because we’ll be doing key/value lookups, rather than considering it as a stream of events:
CREATE TABLE DEVICES AS
    SELECT                               MAC,
           LATEST_BY_OFFSET(SOURCE)   AS SOURCE,
           LATEST_BY_OFFSET(NAME)     AS NAME,
           LATEST_BY_OFFSET(IS_GUEST) AS IS_GUEST
    FROM   ALL_DEVICES
    GROUP BY MAC;
Note: This is an abridged form of the transformation. If you want to see how to wrangle UniFi data so that you can join it to MAC address events, see Learning All About Wi-Fi Data with Apache Kafka and Friends.
With this reference table in place, we can add the name of devices into a new version of the table that we built above:
CREATE TABLE PCAP_STATS_ENRICHED_01 AS
    SELECT D.NAME                           AS DEVICE_NAME
          ,COUNT(*)                         AS PROBE_COUNT
          ,MIN(P.ROWTIME)                   AS FIRST_PROBE
          ,MAX(P.ROWTIME)                   AS LAST_PROBE
          ,COUNT_DISTINCT(P.WLAN_SSID[1])   AS UNIQUE_SSIDS_PROBED
          ,COLLECT_SET(P.WLAN_SSID[1])      AS SSIDS_PROBED
    FROM PCAP_PROBE P
            INNER JOIN
         DEVICES D
            ON P.WLAN_SA[1] = D.ROWKEY
    GROUP BY D.NAME;
When we query the new table, we can see that we have more useful device names shown as opposed to just MAC addresses:
SELECT DEVICE_NAME
     , PROBE_COUNT
     , TIMESTAMPTOSTRING(FIRST_PROBE,'yyyy-MM-dd HH:mm:ss','Europe/London') AS FIRST_PROBE
     , TIMESTAMPTOSTRING(LAST_PROBE,'yyyy-MM-dd HH:mm:ss','Europe/London')  AS LAST_PROBE
     , UNIQUE_SSIDS_PROBED
     , SSIDS_PROBED
  FROM PCAP_STATS_ENRICHED_01
  EMIT CHANGES;
+-------------------+------------+-------------------+-------------------+-------------------+-------------------+
|DEVICE_NAME        |PROBE_COUNT |FIRST_PROBE        |LAST_PROBE         |UNIQUE_SSIDS_PROBED|SSIDS_PROBED       |
+-------------------+------------+-------------------+-------------------+-------------------+-------------------+
|sony-vaio          |23          |2020-03-20 09:21:37|2020-04-11 13:53:13|2                  |[RNM-GUEST, ]      |
|Amazon - Echo      |667         |2020-02-29 06:38:52|2020-04-23 09:31:40|4                  |[null, SKY45BE0, RN|
|                   |            |                   |                   |                   |M0, , RNM-GUEST]   |
|                   |            |                   |                   |                   |                   |
If we modify our Telegram bot code slightly to cater for the new fields, we can now look for device information directly using the name of the device instead of the MAC address:
Event-driven notifications with Telegram and Kafka
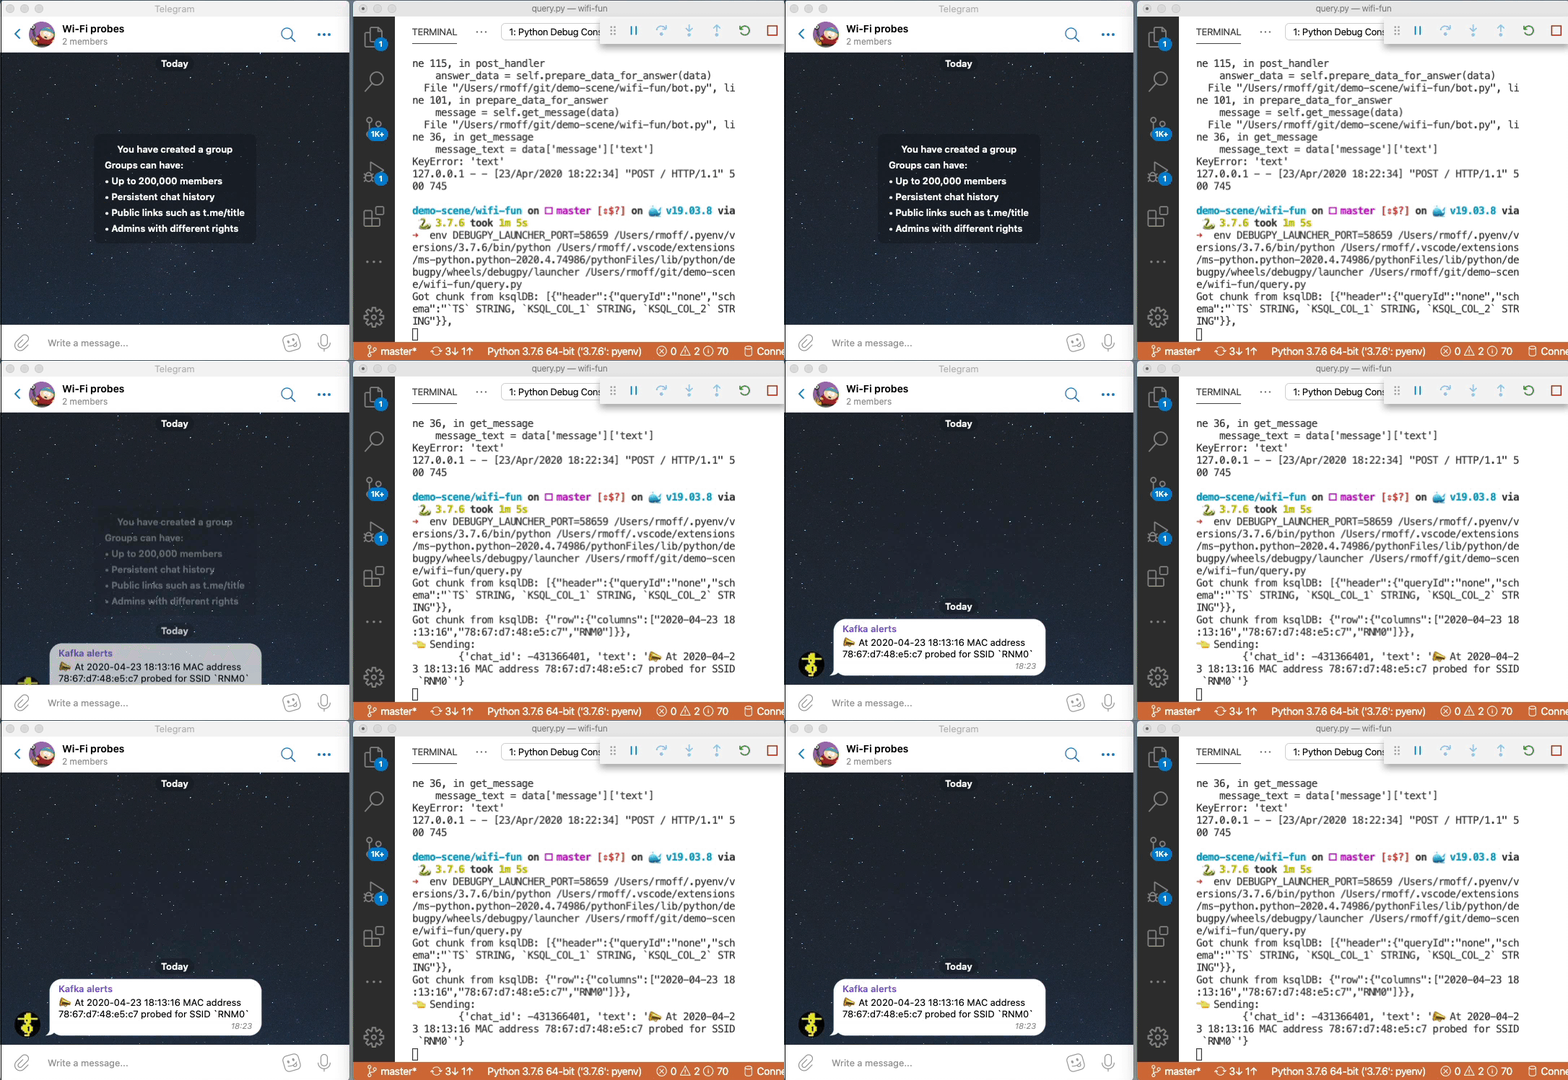
The examples above are built around the idea of serving state to the user prompted by a user action. What about the opposite approach, in which we push something to the user based on an event happening? Events are Kafka’s bread and butter, and any consumer subscribing to a Kafka topic can produce notifications driven by messages arriving on the topic.

Here’s a simple example in which we use the ksqlDB REST API again to deserialise and project the columns from the data that we’re interested in, as well as apply a filter to only alert on probes for a given SSID (WLAN_SSID[1] = 'RNM0'):
ksqlDB_url = "http://localhost:8088/query"
query   = """
    SELECT TIMESTAMPTOSTRING(ROWTIME,'yyyy-MM-dd HH:mm:ss','Europe/London') AS TS,
            WLAN_SA[1],
            WLAN_SSID[1]
        FROM PCAP_PROBE
        WHERE WLAN_SSID[1] = 'RNM0'
        EMIT CHANGES;
       """
…
r = requests.request("POST", ksqlDB_url, headers=headers, data=json.dumps(payload), stream=True)
…
          probe_ts=result['row']['columns'][0]
          probe_mac=result['row']['columns'][1]
          probe_ssid=result['row']['columns'][2]
          sendMessage('📣 At %s MAC address %s probed for SSID `%s`' % (probe_ts,probe_mac,probe_ssid))
There are two magical words to notice in the ksqlDB statement that we’re running:
EMIT CHANGES
This changes the query from a pull query (as we ran above, where the value is returned and the query exits) into a push query, where the query runs continuously and results are pushed to the client. Because Kafka topics are unbounded, so are push queries—they will run forever until you terminate the query, and thus your application can set up a stateful connection to the server and receive any new messages that arrive.
Parameter-driven notifications
Did you see that hard-coded predicate up there ☝️ ?
WLAN_SSID[1] = 'RNM0'
Not nice, is it? What if we want to alert on a different SSID; do we really want to have to recompile our application? Let me show you how you can set up a parameter list that’s dynamically evaluated when an event arrives. In this example, we’ll store a list of SSIDs that we’re interested in alerting against for probes, but the concept could also be easily applied to a variable SLA that you’re tracking or anything conditional really.
Remember those table objects that we talked about above that provide key/value lookups? We used these for stateful aggregations and also for MAC → device name resolution. We’re going to also use a table here to store a list of SSIDs that we’d like to track.
CREATE TABLE SSID_ALERT_LIST (ROWKEY VARCHAR KEY, REASON VARCHAR)
    WITH (KAFKA_TOPIC ='ssid_alert_list_01',
          PARTITIONS  =12,
          VALUE_FORMAT='AVRO');

INSERT INTO SSID_ALERT_LIST VALUES ('RNM0','home network');
INSERT INTO SSID_ALERT_LIST VALUES ('RNM-GUEST','guest network');
Now we amend our query from above to join to this table. Inbound events on the source stream get matched against this table, and if there is a match, a notification is created. Those of an RDBMS bent will recognise what I’ve just described as an INNER JOIN—if there is a match, then return a value.
SELECT TIMESTAMPTOSTRING(P.ROWTIME,'yyyy-MM-dd HH:mm:ss',
                                         'Europe/London') AS TS,
        P.WLAN_SA[1]                                      AS MAC,
        P.WLAN_SSID[1]                                    AS SSID,
        S.REASON                                          AS REASON
   FROM PCAP_PROBE P
        INNER JOIN SSID_ALERT_LIST S
        ON P.WLAN_SSID[1] = S.ROWKEY
EMIT CHANGES;
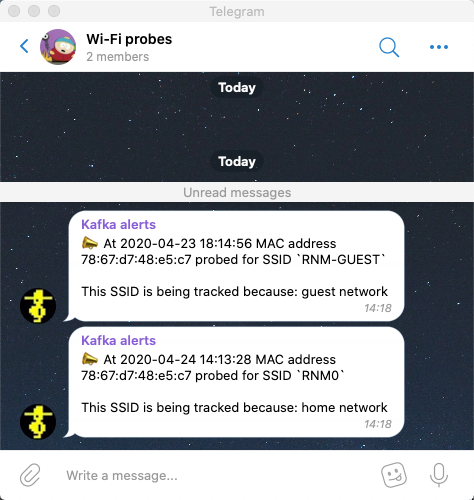
The ksqlDB returns a dataset that looks like this:
+--------------------+------------------+----------+--------------+
|TS                  |MAC               |SSID      |REASON        |
+--------------------+------------------+----------+--------------+
|2020-04-23 18:14:56 |78:67:d7:48:e5:c7 |RNM-GUEST |guest network |
We parse the dataset and send it to the Telegram REST API each time we receive a new result that matches an SSID in the table:
A ksqlDB table is backed by a topic in Kafka, and values can be updated and deleted as well as created. There are several ways we can populate this, including the example above using ksqlDB. In practice, you may want to populate such a table in other ways:
- Produce messages directly to a Kafka topic with the producer API from an application
- Ingest messages into the Kafka topic from another system (e.g., a database with Kafka Connect)
Conclusion
Events model the world around us, and we can build applications that respond to and reason about these using Kafka and ksqlDB. ksqlDB can filter a stream of events to drive an application for notifications, such as the example here to tell someone when a device scans for a given network. ksqlDB also supports materialised views, from which the state can be queried over the REST API.
We saw in this article how that can be used to take user input to look up information about a device’s behaviour on the network, such as the number of times it had scanned and for which network. The first example showed a simple lookup using a device’s MAC address. We then built on this to ingest data from MongoDB into Kafka using ksqlDB’s integration capabilities and joined this data so that we could look up devices using characteristics from the data in MongoDB, such as the device’s name.
To learn more, get started with ksqlDB today and head over to developer.confluent.io. You can find the full code for the Telegram bots on GitHub.
Did you like this blog post? Share it now
Subscribe to the Confluent blog
3 Strategies for Achieving Data Efficiency in Modern Organizations
The efficient management of exponentially growing data is achieved with a multipronged approach based around left-shifted (early-in-the-pipeline) governance and stream processing.
Chopped: AI Edition - Building a Meal Planner
Dinnertime with picky toddlers is chaos, so I built an AI-powered meal planner using event-driven multi-agent systems. With Kafka, Flink, and LangChain, agents handle meal planning, syncing preferences, and optimizing grocery lists. This architecture isn’t just for food, it can tackle any workflow.

