[Virtual Event] GenAI Streamposium: Learn to Build & Scale Real-Time GenAI Apps | Register Now
The Blog Post on Monitoring an Apache Kafka Deployment to End Most Blog Posts
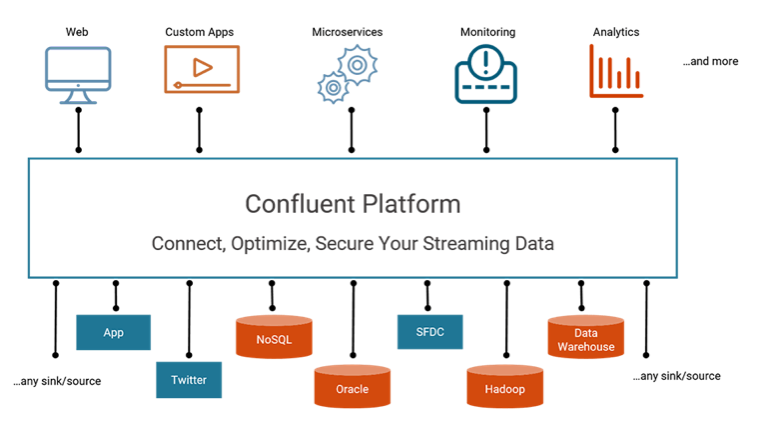
Monitoring helps provide assurances that all your services are working properly, meeting SLAs, and addressing business needs. In thinking about an operationally sound monitoring solution, think through what the business cares about. Here are some common business-level questions:
- Are applications receiving all data?
- Are my business applications showing the latest data?
- Why are the applications running slowly?
- Do we need to scale up?
- Can any data get lost?
- Will there be service interruptions?
- Are there assurances in case of a disaster event?
Notice that these are platform-agnostic questions, however, as the Kafka operator you certainly have to be able answer them in a Kafka-specific way.
You may think Kafka is running fine, but how do you prove it?
How do you ensure that the applications are developed well? How do you prove that they are successfully streaming messages through Kafka at low latency? Can you run more streaming applications on top of your existing Kafka cluster? Can you identify performance bottlenecks and tune your cluster as you scale it up or as the data profile changes?
Your Kafka monitoring solution needs to provide application-level visibility: you cannot fix problems you cannot see. This rest of this blog post is about how to monitor your Kafka deployments in real-time. Regardless whether you are using ksqlDB, the Kafka Streams API, Kafka Connect, or any other clients, you can monitor your cluster like a Kafka pro. We will discuss essential things to monitor, the requirements of a Kafka monitoring solution, and the key advantages of the Control Center monitoring solution.
The metrics swamp
Kafka exposes hundreds of metrics. Some of them are per broker, per client, per topic, and per partition, and so the number of metrics scales up as the cluster grows. For an average-size Kafka cluster, the number of metrics very quickly bloats to the thousands.
Warning: I am about to disappoint you. You probably recognize that you realistically cannot monitor every single available metric. So you are probably hoping that in this blog post I will filter down the list of metrics to a dozen of the most critical ones, which you would then push through some generic monitoring tool, and then be done with setting up “monitoring.” However, monitoring distributed systems like Kafka is not that simple, and so there is no such list. Keep reading to understand the problems you should be solving, and how to solve them in a robust monitoring solution specifically designed for Kafka.
A common pitfall of generic monitoring tools is that they import all available metrics from a variety of systems into a metrics swamp. Even with a comprehensive list of metrics, there is a limit to what can be achieved with no Kafka context nor Kafka expertise to determine which metrics are important and which ones are not. A metrics swamp cannot produce valuable insight from the data nor provide answers to the critical business questions we asked earlier.
For example, what does it really mean if the metric kafka.network:type=RequestMetrics,name=RemoteTimeMs,request=Produce has a value of 5 for the 95% percentile? What action should you take in response? Is it important enough to trigger an alert or not?
How many times have you seen generic monitoring tools that just display grids of metrics charts? When presenting data this way, people end up referring to just the two or three charts that they actually understand. Meanwhile, they ignore all the other charts because they don’t understand them. So this presentation wastes valuable real estate, generates a lot of noise as people spend time chasing “issues” that aren’t impactful to the services, or worse, it obscures real problems.
Confluent Control Center
Kafka is a distributed system with many moving parts, including producers, consumers, consumer groups, brokers, a controller, ZooKeeper, topics, partitions, leaders, replicas, messages, and more. Generic tools that build metrics swamps can’t interpret and monitor cluster-wide events in this type of system. You need a domain-specific monitoring solution that is designed for Kafka from Day Zero.
Confluent Control Center provides real-time visibility into the wellbeing of your Kafka deployment. From its inception, it was designed to help operators identify the most important things to monitor in Kafka, including the cluster and the client applications producing messages to and consuming messages from the cluster. Control Center has a dedicated team of product engineers at Confluent backed by an entire company with years of Kafka operational and development experience, so they know how to focus monitoring in your Kafka deployment and filter out distracting metrics.
In addition to a variety of useful management features (for details, please refer to our documentation), Control Center provides a couple of key monitoring features:
- End-to-end stream monitoring shows if every single message is delivered for assurance that your applications are working properly
- System health provides insight into the well-being of the Kafka cluster from the cluster perspective, and allows you to drill down to the broker level and topic level perspectives
- Alerting to notify you when important things happen in the cluster
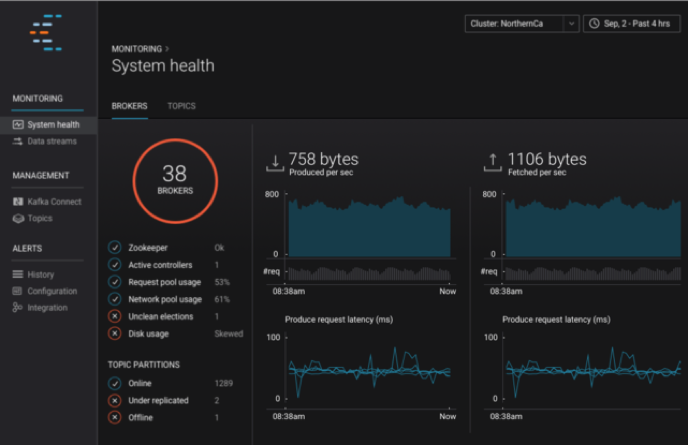
Now let’s walk through the important questions we asked at the start of the blog post, that you need to be able to answer.
Are applications receiving all data?
When every single message running through your Kafka cluster is critical to your business, you may need to demonstrate that every single message that a Kafka client application produces to Kafka is consumed on the other side. Control Center’s stream monitoring helps you know that messages are delivered end to end.
There may be some scenarios where Kafka is working as designed, but messages may unintentionally not be consumed. Consider these scenarios:
- A consumer is offline for a period of time that is longer than the consumer offsets retention period (offsets.retention.minutes). When the application restarts, by default it sets consumer offsets to latest (auto.offset.reset) and thus will miss consuming some messages.
- A consumer is offline for a period of time that is longer than the log retention period (log.retention.hours). By the time the application restarts, messages will have been deleted from the data log files and never consumed.
- A producer is configured with weak durability guarantees, for example it does not wait for multiple broker acknowledgments (e.g., acks=0 or acks=1). If a broker suddenly fails before having a chance to replicate a message to other brokers, that message will be lost.
There are other scenarios where consumers are intentionally not consuming some messages that were produced to the Kafka cluster. When consumers are stopped for a period of time and then restarted, catching up means processing all the messages produced while they were offline, with high latency. To avoid incurring the high latency, sometimes operators intentionally reset the consumer offsets to the latest offset before restarting the consumers. This is especially important for real-time applications with low latency requirements.
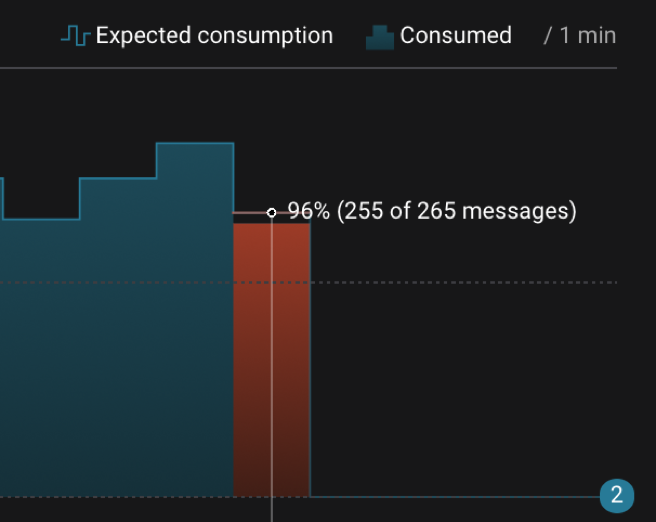
Control Center end-to-end stream monitoring shows message delivery statistics aggregated per cluster, or with drill-down capability per consumer or consumer group or per topic. This is achieved through Confluent Monitoring Interceptors, which report message delivery statistics as messages are produced and consumed. If you start a new consumer group for a topic (assuming you configured Confluent Monitoring Interceptors on the clients), Control Center automatically displays end-to-end stream monitoring accounting for the new consumer group. Then Control Center processes the message delivery statistics and reports on actual message consumption versus expected message consumption. Messages are associated with a particular time bucket during which they were produced, and for that particular time bucket, Control Center compares the number of messages produced and number of messages consumed. If all messages produced were consumed, then it shows actual consumption equals the expected consumption; otherwise, Control Center can alert that there is a difference.
The following diagram is a screenshot from a built-in dashboard in Control Center that shows a consumer group that was under-consuming during a given time bucket. Of the 265 messages produced in that time bucket, only 255 messages were consumed by this consumer group.
Control Center also monitors consumer group membership and partition assignment, and it updates automatically if consumer group rebalances occur. If a consumer group rebalances, partitions may be reassigned among the new consumers in the consumer group. While there may be no change in consumption at the consumer group level, your applications may actually pause during rebalancing. You can use Control Center stream monitoring to track individual consumer-partition assignments and observe pauses happening at the individual consumer level.
Are my business applications showing the latest data?
Now you know if all your messages are being produced and consumed end to end, but you also need to know if they are being processed with low latency, and likely you even have SLAs for real-time applications that give you specific latency targets you need to hit. Imagine you have a business application that needs to show real-time data, or a mobile app that needs to show the latest credit card transactions. For those scenarios, you must meet tight SLAs, and you need to show whether your platform is meeting those SLAs, and be notified if it isn’t.
Detecting high latency and comparing actual consumption against expected consumption is difficult without end-to-end stream monitoring capabilities. You could instrument your application code, but that carries the risk that the instrumentation code itself could degrade performance. Plus, wouldn’t it be great to extract that cross-cutting concern from your developers entirely, and let them focus on application development? As it turns out, Confluent Platform enables you to do just that. The Confluent Metrics Reporter collects important data about the cluster and the Confluent Monitoring Interceptors collect important data about the applications that allow Control Center to monitor end-to-end throughput performance and latency per consumer group, consumer, or per topic.
Control Center monitors stream latency from producer to consumer, and can catch a spike in latency as well as a trend in gradually increasing latency. As the diagram below shows, both the consumer on the left and the consumer on the right are processing all the messages from a given Kafka topic. Neither consumer is dropping messages, however, compare the latency. The slow consumer on the left is processing the messages with extremely high latency as compared to the well-behaving consumer on the right. As a Kafka operator, you want to identify spikes in latency and slow consumers trending higher latency, before customers start complaining about lagging business reports or lagging credit card transactions in mobile apps.

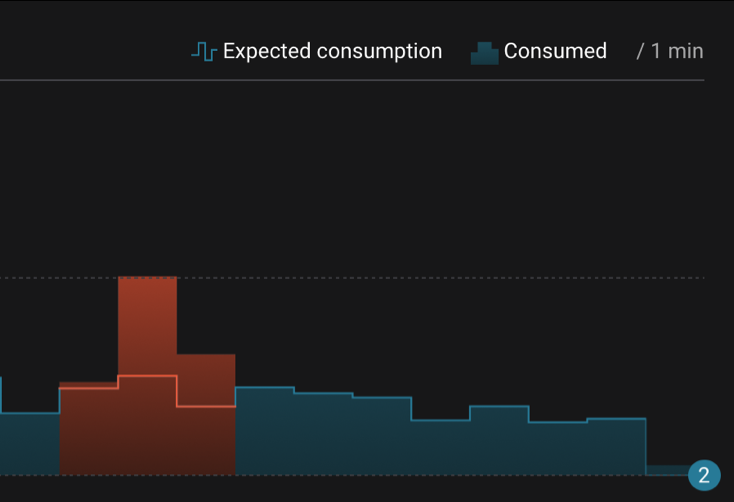
In another case, perhaps the consumer is over-consuming (i.e., processing messages more than once; see red bars in the diagram below), which would also result in higher latency. If the client application is idempotent, then functionally the application will appear to be working fine because it is not missing any messages, but it’s inefficient to process messages more than once. Worse, if the client application is not idempotent, processing duplicate messages could break the application. Consider these scenarios for over-consumption:
- Intentionally: an application with a software bug consumed and processed Kafka messages incorrectly, got a fix, and then reprocessed the old messages correctly.
- Unintentionally: an application crashes before committing processed messages.
Control Center stream delivery detects application over-consumption, as depicted by the red bars in the diagram below. In those time buckets shown, the actual consumption exceeded the expected consumption because the consumer group processed messages more than once due to some event. Not only does Control Center enable you to detect the event, it also helps you ensure that the application recovered properly. For example, while reprocessing messages more than once, the application may have experienced higher than normal latency. After you detect this over-consumption, you can then monitor application latency to ensure it recovers to normal levels once the application catches up to current messages.
Why are the applications running slowly?
You absolutely need to baseline and monitor performance of your Kafka cluster to be able to answer general questions like “Why are the applications running slowly?” or more specific questions like “Why are a few of my application produce requests timing out?” If you want to optimize your Kafka deployment for high throughput or low latency, follow the recommendations in Optimizing Your Apache Kafka Deployment: Levers for Throughput, Latency, Durability, and Availability. Then Control Center can identify bottlenecks and you can further improve performance.
While Control Center does show you throughput measurements in aggregate across the cluster as well as per broker and per topic, this alone is a naive perspective on performance. To identify performance bottlenecks, it is pivotal to break down the Kafka request lifecycle into phases and determine how much time a request spends in each phase. (Make sure you understand how the Kafka protocol works and the lifecycle of messages as they are produced to and consumed from the cluster via requests and responses. Read this Kafka protocol guide for details.) The diagram below is a built-in view in Control Center that shows the entire request lifecycle on a given broker.
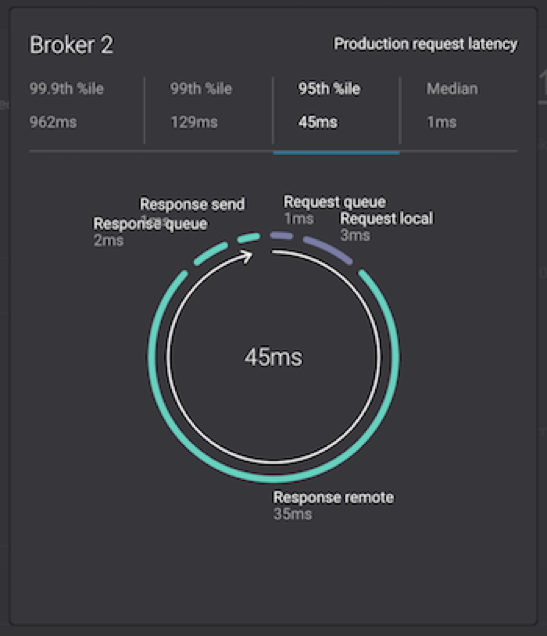
Usually, you start by observing the total request time, which can be shown in the median, 95th, 99th, or 99.9th percentiles, and if it is higher than you want, drill down into each phase:
- Request queue
- Request local
- Response remote
- Response queue
- Response send
The phase in which the broker is spending the most time in the request lifecycle may indicate one of several problems: slow CPU, slow disk, network congestion, not enough I/O threads, or not enough network threads. Or perhaps there just is not enough incoming data to return in a fetch response, so the broker is simply waiting. Combine this information with other important indicators like the fraction of the time request handler threads or network process threads are busy. Then focus your investigations, figure out the bottlenecks, consider tuning the settings, e.g., increasing the number of I/O threads (num.io.threads) or network threads (num.network.threads), or take some other action. Check our documentation for further information.

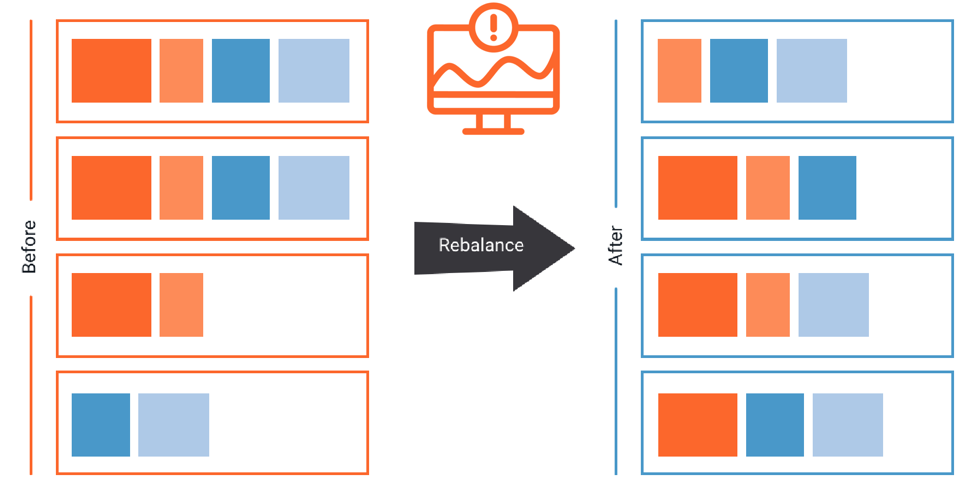
Topic partition leadership also impacts broker performance: the more topic partitions that a given broker is a leader for, the more requests the broker may have to process. Therefore, if some brokers are have more leaders than others, you may have an unbalanced cluster when it comes to performance and disk utilization. Control Center provides certain indicators like:
- Number of requests each broker is processing
- Disk used by data log files on each broker
- Cluster-wide balance status
You can take action by rebalancing the Kafka cluster using the Auto Data Balancer. This rebalances the number of leaders and disk usage evenly across brokers and racks on a per topic and cluster level, and can be throttled so that it doesn’t kill your performance while moving topic partitions between brokers.
Do we need to scale up?
Capacity planning for your Kafka cluster is important to ensure that you are always able to meet business demands. You probably did some resource sizing at initial deployment, but since then the production Kafka cluster has likely to need to scale up as the number of applications or data volume increases. Avoid getting caught off guard with a degraded cluster performance that impacts application performance, and instead be proactive about capacity planning. Look beyond generic CPU, network, and disk utilization; use Control Center to monitor Kafka-specific indicators that may indicate the Kafka cluster is at or near capacity:
- Broker processing (details in previous section “Why are the applications running slowly?”)
- Network pool usage
- Thread pool usage
- Produce request latencies
- Fetch request latencies
- Network utilization
- Throughput, aggregated for the cluster
- Throughput, per broker
- Disk space
- Disk utilization by all data log segments, per broker
It is very important to take corrective action on capacity issues in your cluster before it is too late. For example, if you notice that your network pool utilization is high and CPU on the brokers is high, you may decide to add a new broker to the cluster and then move partitions to the new broker. However, note that the mere action of moving partitions uses additional CPU and network capacity, and so if you try to add brokers when you are already close to 100% utilization, the process will be slow and painful. Consequently, it is important to address this sooner than later. Control Center provides sensible thresholds for some indicators, like the pre-defined threshold of 70% for the network pool utilization, which ensures that you can stay ahead of and address capacity issues early enough to painlessly scale up the cluster.
In addition to monitoring capacity in your Kafka cluster, also monitor capacity in your Kafka applications to decide if you need to linearly scale their throughput. If Control Center stream monitoring shows consumer group latency trending higher and higher over time, it may be an indication that the existing consumers cannot keep up with the current data volume. To address this, consider adding consumers to the consumer groups, assuming there are enough partitions to distribute across all the consumers.
Can any data get lost?
Your mission critical business applications may require you to optimize for high durability, which guarantees that messages that have been committed will not be lost. Kafka is well known for high durability guarantees; in a real customer use case, as described in Publishing with Apache Kafka at The New York Times, all of The New York Times published content from 161 years of journalism (as of this writing!) is produced to Kafka. Operationally, you want assurance that data produced to Kafka will not get lost.
The most important feature that enables durability is replication. This ensures that messages are copied to multiple brokers, and so if a broker has a failure, the data is still available from at least one other broker. Topics with high durability requirements should have the configuration parameter replication.factor set to 3, which will ensure that the cluster can handle a loss of two brokers without losing the data. (There are numerous other configuration settings that you should tune to optimize for durability, and they are also discussed in Optimizing Your Apache Kafka Deployment: Levers for Throughput, Latency, Durability, and Availability).
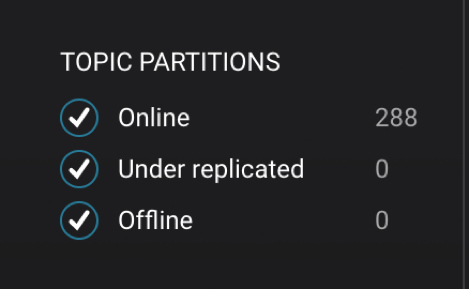
The number of under-replicated partitions is the best indicator for cluster health: there should be no under-replicated partitions in steady state. This provides assurance that data replication is working between Kafka brokers and the replicas are in sync with topic partition leaders, such that if a leader fails, the replicas will not lose any data. Control Center makes it easy to monitor under-replicated partitions, helping operators ensure data durability. Check the built-in dashboard in the system health view landing page to instantly see topic partition status across your entire cluster in a single view. Under-replicated topic partitions is one of the most important issues you should always investigate—and you can set an alert for this in Control Center!
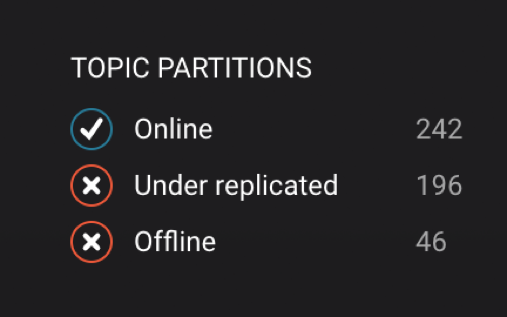
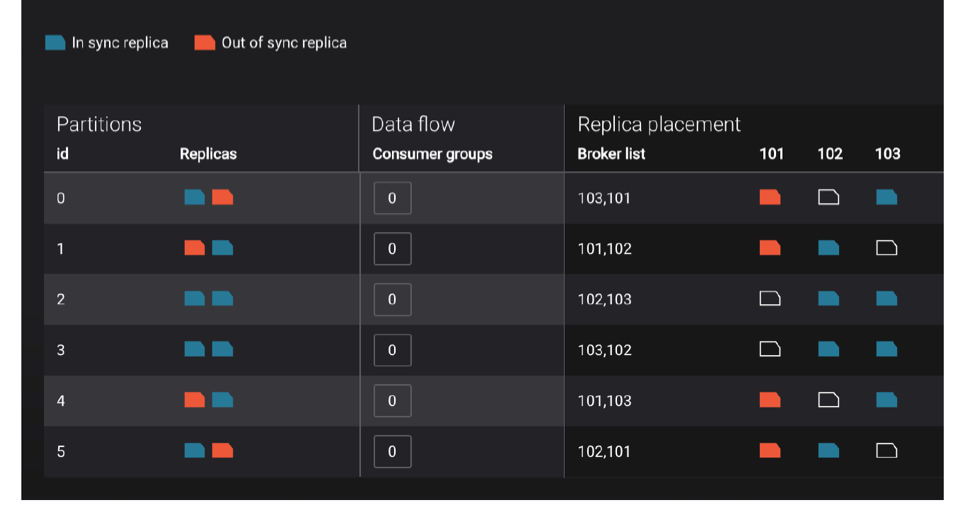
If the number of under-replicated or offline partitions is greater than zero, you’ll need to investigate. Drill down to further isolate the problem. In the diagram below that shows a single topic’s partition placement, the broker with the problem should jump out at you. Now follow-up and investigate what is causing that broker to fall out of sync. It could be a resource issue, hardware problem, noisy co-located application, etc.
Will there be service interruptions?
Software upgrades, broker configuration updates, and cluster maintenance are all expected parts of Kafka operations. If you need to schedule any of these activities, you may need to do a rolling restart through the cluster, restarting one broker at a time. A rolling restart executed the right way can provide high availability by avoiding downtime for end users. Doing it suboptimally may result in downtime for users, or worse: lost data.
Some important things to note before doing a rolling restart:
- Because at least one replica is unavailable while a broker is restarting, clients will not experience downtime if the number of remaining in sync replicas for that topic partition is greater than the configured min.insync.replicas.
- Run brokers with controlled.shutdown.enable=true to migrate topic partition leadership before the broker is stopped.
- The active controller should be the last broker you restart. This is to ensure that the active controller is not moved on each broker restart, which would slow down the restart.
Control Center can help shepherd the rolling restart of your Kafka cluster. We encourage you to install Control Center before upgrading Apache Kafka to monitor broker status and application availability when performing the rolling upgrade. Make sure each broker is fully online before restarting the next one. “Fully online” doesn’t just mean receiving a Linux prompt—your entire cluster needs to recognize this broker as being online, and replicas on this broker should be in sync to the topic partition leaders. Confirm that each Kafka broker is restarted and is back to operational status before restarting the next broker to avoid risk of service interruption to your applications. Quickly glean from the high-level “check engine light” on the landing page if you’re good to go.

With regard to data durability and under-replicated topic partitions, you shouldn’t even begin a cluster rolling restart if all the topic partitions are not online and fully in sync. This is such a common and critical operational issue that we recommend configuring alerts if there are any topic partitions that are under-replicated or offline. During a single broker restart, the number of under replicated topic partitions or offline partitions may increase, and then once your broker is back online, the numbers should recover to zero. This indicates that data replication and ISRs are caught up. Now restart the next broker.
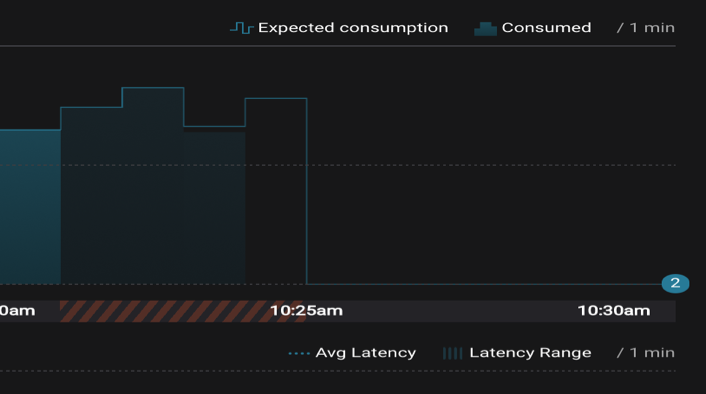
Another factor in avoiding service interruptions is considering how applications are stopped. It is best to stop consumers gracefully, which allows them to follow the shutdown sequence. Control Center stream delivery can provide indicators that a consumer stopped ungracefully by marking the time buckets around the shutdown time, as shown in the diagram below with the red and black stripes. You can correlate this information to potential service interruptions, and furthermore, improve operational practices to avoid ungraceful shutdowns in the future.
Are there assurances in case of a disaster event?
Control Center can help you with your multi-data-center deployment and prepare for disaster recovery in case disaster strikes. It can manage multiple Kafka deployments in different data centers, even between Confluent Cloud and on-prem deployments. Below is a diagram for an active-active multi-data-center deployment, and Confluent Replicator is the key to synchronize data and metadata between the sites. Control Center enables you to configure and run Confluent Replicator to copy data between your datacenters, and then you can use stream monitoring to ensure end-to-end message delivery.
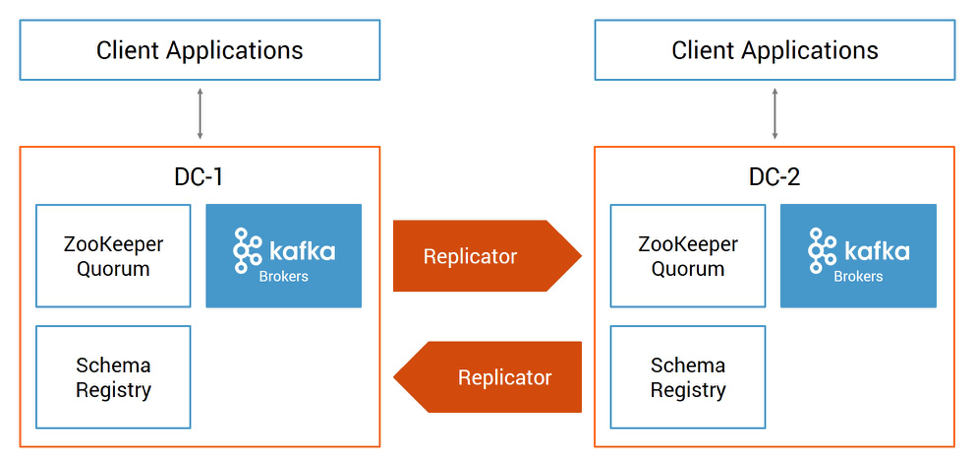
Once Replicator is deployed, monitor Replicator performance and tune it to minimize replication lag, which is the delay between messages written to the origin cluster but not yet copied to the destination cluster. This is important because processing at the destination cluster will be delayed by this lag, and secondly, in case of a disaster event, you may lose messages that were produced at the origin cluster but weren’t replicated yet to the destination cluster.
Easily monitor Replicator in Control Center because it is a connector and can be monitored like any other Kafka connector. Run Replicator with Confluent Monitoring Interceptors to get detailed message delivery statistics. Specifically, monitor end-to-end measurements, looking at two intervals to find the replication lag and isolate the component responsible for the delay:
- From the time the events were produced to the origin Kafka cluster to the time Replicator consumed them
- From the time Replicator produced the events to the destination Kafka cluster to the time destination consumers processed them
Your monitoring solution is a….streaming platform!
Now that we have discussed the essential things to monitor in clusters and applications, let’s talk about what the Kafka monitoring solution should actually be. At a very high level, the basic components of a monitoring solution include the following.
Transport: a reliable means of getting metrics and other information out of the target system being monitored.
Storage: durable method of saving a large amount of time series data, and prevent false negatives due to misbehaving monitoring tools losing data.
Processing: interpreting and correlating raw data into something meaningful to Kafka.
Visualization: well-designed dashboards that focus attention on critical Kafka problems.
 The market offers some legacy open source projects that do bits of this stack. However, it is a fallacy to say that making a good Kafka monitoring solution is just an exercise of integrating these disparate bits of software together. Some challenges in this do-it-yourself project:
- “Just an integration exercise” is still a technically difficult problem to solve well
- It costs a lot of money and time to stitch together pieces of software
- You still need to customize all these generic components for the Kafka domain
- Configuration is often hard to do and documentation is hard to come by
- You still need to customize dashboards
- On-going maintenance burden
- Upgrading components one at a time may result in breakage
- The overall tool stales as the Kafka cluster capabilities evolve
- This stitched-together monitoring tool just introduced four new things to monitor
Some third party vendors try to address the challenges above by taking on the burden themselves to stitch together a monitoring tool. However, in this case, users still have the same deployment challenges and the vendors still have the same functional limitations. Sometimes a vendor sells a solution with a visually captivating GUI, maybe it’s even got a YouTube video montage with cool music, but it is not a solution that focuses on what is most critical to monitor nor does it scale with your Kafka cluster. Their solutions still look like a metrics swamp, lack Kafka domain context, lack understanding of the complexities of monitoring distributed systems, are unable to correlate operational issues to Kafka protocols, data replication, and ultimately cannot identify critical issues.
Because these third party monitoring tools are overly generalized and not part of the Kafka ecosystem, these tools will always be a few steps behind Kafka features. They can’t stay in sync with whatever latest Kafka monitoring capabilities are exposed, and the tools suffer the same staleness problem. At the end of the day, those other tools aren’t well designed for the purposes of, nor integrated into, Kafka.
The right way to approach your monitoring solution is to think about what business problems you are trying to address. If you have a mission critical service built on Kafka, it’s probably because you need a streaming ETL platform that is:
- Performant
- Scalable
- Durable
- Highly Available
- Secure
And if you have committed your business to Kafka then you should apply the same criteria when choosing a monitoring solution for your business. Monitoring is not a nice-to-have, post-production afterthought. Monitoring solutions must not be flaky. They should not present meaningless data. They have to handle high throughput, scale out as cluster sizes grow, not lose important metrics, handle failures in the monitoring infrastructure, and be secure. So we’re looking for a Kafka-specific monitoring solution that provides transport, storage, processing, and visualization, and is coincidentally also:
- Performant
- Scalable
- Durable
- Highly Available
- Secure
Don’t these sound familiar? The characteristics we want in a monitoring solution are already available in Kafka! Kafka is a streaming platform that enables scalable event-driven applications and pipelines, and so of course it is sensible to use Kafka as the backend your monitoring solution. A monitoring system is, by definition, a collection of events and pipelines that produces streams of data for processing into meaningful contexts. With Control Center, Kafka clients “transport” monitoring data to Kafka, save them to that Kafka cluster for “storage”, “process” the data into meaningful contexts using the Kafka Streams API, and then “visualize” system health and message delivery statistics in a custom designed-for-Kafka easy-to-use GUI. Kafka’s continued improvements in performance, scalability, durability, availability and security automatically become Control Center improvements.
The Confluent Advantage
Monitoring your Kafka production cluster with Confluent Control Center that is backed by Kafka provides several key advantages:
- Control Center monitors what is important
- Control Center inherits performance and scalability improvements in Kafka
- Control Center provides a 2-for-1 efficiency in operations
- Control Center provides a unified security configuration experience
- Confluent subscription can support your production cluster and monitoring solution
Let’s look at these one-by-one:
- Control Center monitors what is important
Control Center’s monitoring capabilities were designed from Day Zero with Kafka in mind, so it purposefully conveys what is important, helps diagnose problems, and identifies performance bottlenecks. Control Center also defines sensible thresholds so users don’t have to guess: the System Health view in particular highlights if an indicator is above a pre-defined threshold. A checkmark will turn to a red “X”, for example, if the network pool usage or request pool usage exceeds 70%, if the Kafka disk utilization is not evenly distributed across the cluster, and always important, if the number of under replicated or offline partitions is greater than zero.
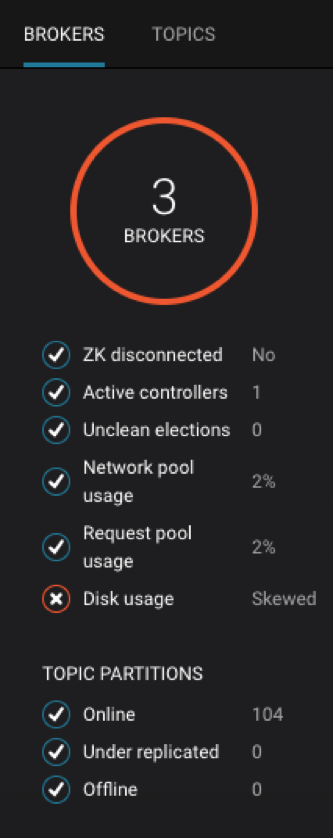 And Control Center is just as elastic as your cluster is elastic. Did you add a new broker to your cluster? Control Center automatically reports the new broker (assuming you configured the new broker for monitoring) so you can ensure it is replicating data properly. Did you add a new topic to your cluster? Control Center automatically reports data on the new topic so you can validate it has proper replication configuration and its replicas are in sync.

2. Control Center inherits performance and scalability improvements in Kafka
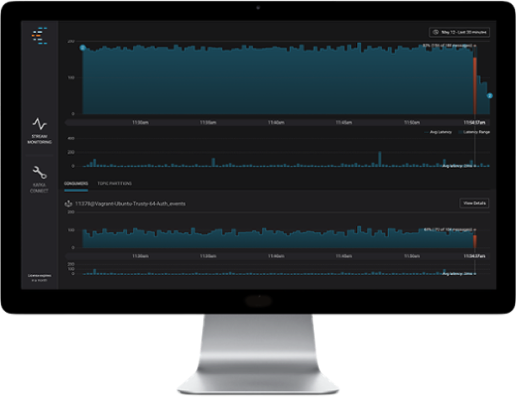
Control Center processing is implemented as a Kafka Streams application, so all underlying Kafka improvements and Kafka streams improvements are inherited by Control Center. For example, in the recently released version of 4.0, Control Center leverages memory management features of Kafka Streams to cache records optimally, thereby saving intermediate writes and optimizing network bandwidth. This results in huge improvements in performance and scalability.
 3. Control Center provides a 2-for-1 efficiency in operations
Using Control Center for monitoring removes extra layers of complexity by making it easy to deploy with Confluent Platform. The deployment is easier and the operations is easier: since you already have the Kafka expertise for your production data cluster, your expertise transfers to the monitoring solution. Since you know how to scale out your production cluster, you know how to scale out your monitoring cluster. Since you already have maintenance runbooks for your production cluster, you know your maintenance runbooks for your monitoring cluster.
4. Control Center provides a unified security configuration experience
Since you know how to configure security on your production Kafka cluster, you can configure security for Control Center in a unified way. In contrast, if you are using third party monitoring tools, it is painful to configure and maintain security in a totally different interface from your production Kafka deployment, if those monitoring tools even support security features at all.
Why do security requirements apply to monitoring solutions as much as they apply to the underlying infrastructure that is moving the data? Because the data itself, as well as topic names, consumer group names, etc., may all include sensitive information. It should have protected access and should not be compromised, so it is important that the monitoring solution be secured. Control Center has a unified configuration experience in supporting the same SSL/TLS, SASL, and ACL feature sets as your production Kafka cluster. If your Kafka cluster is configured for authentication, authorization, and encryption, then configure Control Center in the same way.
 You can also configure HTTP basic authentication to the Control Center GUI, plugging in the Active Directory LDAP LoginModule or any other Java Authentication and Authorization Service (JAAS) LoginModule. Whenever a user tries to access the Control Center GUI, they will be prompted for a username and password and authenticated against the configured security configurations—only authorized users will get access.
5. Confluent subscription can support your production cluster and monitoring solution
Should any unexpected issues arise, you can have a single phone number to call for enterprise-level support. Confluent provides world-class Kafka support, regardless if the issue is in the production cluster or monitoring cluster. The Confluent Platform subscription is offered at a range of service levels which may include:
-
-
- 24/7 support
- Access to the Confluent Knowledge Base
- Response times as fast as 30 minutes based on SLA
- Full application lifecycle support from development to operations
- Emergency patches not yet included in the open source Apache distribution
-
Setup Confluent Control Center today
Mission critical applications built on Kafka need a robust and Kafka-specific monitoring solution that is performant, scalable, durable, highly available, and secure. Confluent Control Center was designed for Kafka from Day Zero. Control Center avoids the distractions of a metrics swamp, and it provides just the most important information to act on so you can address important business-level questions:
- Are applications receiving all data?
- Are my business applications showing the latest data?
- Why are the applications running slowly?
- Do we need to scale up?
- Can any data get lost?
- Will there be service interruptions?
- Are there assurances in case of a disaster event?
To get hands on with Control Center, check out our Confluent Platform Demo GitHub repo called cp-demo. Following the realistic scenario in this repo, you can setup a Kafka cluster and Control Center within a few seconds, and then walk through a playbook of various operational events.
You can also watch the Control Center video tutorials, part of the Monitoring Kafka in Confluent Control Center series.
Did you like this blog post? Share it now
Subscribe to the Confluent blog
New with Confluent Platform 7.9: Oracle XStream CDC Connector, Client-Side Field Level Encryption (EA), Confluent for VS Code, and More
This blog announces the general availability of Confluent Platform 7.9 and its latest key features: Oracle XStream CDC Connector, Client-Side Field Level Encryption (EA), Confluent for VS Code, and more.
Meet the Oracle XStream CDC Source Connector
Confluent's new Oracle XStream CDC Premium Connector delivers enterprise-grade performance with 2-3x throughput improvement over traditional approaches, eliminates costly Oracle GoldenGate licensing requirements, and seamlessly integrates with 120+ connectors...


